Ensemble Statistics
Description
The Ensemble module is a tool to perform uncertainty quantification and visualising the ensemble statistics namely, mean and standard deviation. It is also possible to calculate the weighted mean and standard deviation in case of multi-model ensemble. This module contains three main classes namely, EnsembleTimeseries, EnsembleLatLon and EnsembleZonal. Additionally, this module also contains three supporting plotting classes namely, PlotEnsembleTimeseries, PlotEnsembleLatLon and PlotEnsembleZonal.
The EnsembleTimeseries class takes 1D xarray.Dataset timeseries as input and performs following functionalities: - Computes ensemble mean and standard deviation (Point-wise along time axis) for monthly and annual timeseries.
The PlotEnsembleTimeseries class takes 1D xarray.Dataset timeseries as input and performs the following functionalities: - Plots the ensemble-mean and 2x ensemble-std ± ensemble-mean along the given timeseries. - Note that the standard deviation is Point-wise along time axis. - A reference timeseries can also be plotted.
The EnsembleLatLon class takes 2D LatLon xarray.Dataset as input and performs the following functionalities: - Compute ensemble mean and standard deviation for 2D Maps.
The PlotEnsembleLatLon class takes 2D LatLon xarray.Dataset as input and performs the following functionalities: - Plots the ensemble mean and standard deviation separately on two different maps.
The EnsembleZonal class take zonal-averages Lev-Lon xarray.Dataset as input and performs the following functionalities: - Computes ensemble mean and standard deviation of the given input.
The PlotEnsembleZonal class take zonal-averages Lev-Lon xarray.Dataset as input and performs the following functionalities: - Plots the ensemble mean and standard deviation of the computed statistics.
Structure
ensembleTimeseries.py: contains the EnsembleTimeseries class.plot_ensemble_timeseries.py: contains the PlotEnsembleTimeseries class.ensembleLatLon.py: contains the EnsembleLatLon class.plot_ensemble_latlon.py: contains the PlotEnsembleLatLon.py class.ensembleZonal.py: contains the EnsembleZonal class.plot_ensemble_zonal.py: contains the PlotEnsembleLatLon.py class.cli_timeseries_ensemble.py: the command line interfance (CLI) script to run the ensemble-timeseries 1D diagnostic.cli_global_2D_ensemble.py: the command line interfance (CLI) script to run the ensemble-2D-maps in Lat-Lon diagnostic.cli_zonal_ensemble.py: the command line interfance (CLI) script to run the ensemble-zonal Lev-Lon diagnostic.util.py: contains the retrieve_merge_ensemble_data and compute_statistics functions.base.py: contains the base class which contains functions for saving the output as png, pdf and netcdf.config/diagnostics/ensemble/config_global_2D_ensemble.yaml: config file for cli_global_2D_ensemble.py.config/diagnostics/ensemble/config_timeseries_ensemble.yaml: config file for ensembleTimeseries.py.config/diagnostics/ensemble/config_zonalmean_ensemble.yaml: config file for ensembleZonal.py.
Input variables
In order to use the Ensemble module, a pre-processing step is required. To load and to merge the input data, aqua.diagnostics.ensemble.util.retrieve_merge_ensemble_data can be used which takes the list of paths of data or uses catalog entries. In this step one has to merge all the given 1D timeseries, 2D Lat-Lon Map and Zonal-averages Lev-Lon for EnsembleTimeseries, EnsembleLatLon and EnsembleZonal along a pesudo-dimension, respectively. The default dimension is simply named as ensemble and can be changed. One can load the data directly as xarray.Dataset or can use the aqua Reader class. For example loading and merging a 2D maps ensemble into an xarray,Dataset:
import glob
from  aqua.diagnostics import retrieve_merge_ensemble_data

file_list = glob.glob('/work/ab0995/a270260/pre_computed_aqua_analysis/*/historical-1990/atmglobalmean/netcdf/atmglobalmean.statistics_maps.2t.*_historical-1990.nc')
file_list.sort()
ens_dataset = retrieve_merge_ensemble_data(
    variable='2t',
    model_names= ['IFS-FESOM', 'IFS-NEMO'],
    data_path_list=file_list,
    log_level = "WARNING",
    ens_dim="ensemble",
)
A seond method:
ens_dataset = retrieve_merge_ensemble_data(
    variable='2t',
    catalog_list=['null', 'null'],
    models_catalog_list=['IFS-FESOM', 'IFS-NEMO'],
    exps_catalog_list=['historical-1990', 'historical-1990'],
    sources_catalog_list=['aqua-atmglobalmean', 'aqua-atmglobalmean'],
    log_level="WARNING",
    ens_dim="ensemble",
)
The default values for the plotting fuction has been already set as default values. These values can also be by simply defining a python dictionary e.g., in the case of the EnsembleTimeseries,
plot_options = {'plot_ensemble_members': True, 'ensemble_label': 'Multi-model', 'plot_title': 'Ensemble statistics for 2-meter temperature [K]', 'ref_label': 'ERA5', 'figure_size': [12,6]}.
For EnsembleLatLon,
plot_options = {'figure_size': [15,14], 'cbar_label': '2-meter temperature in K','mean_plot_title': 'Map of 2t for Ensemble Multi-Model mean', 'std_plot_title': 'Map of 2t for Ensemble Multi-Model standard deviation'}.
For EnsembleZonal,
plot_options = {'figure_size': [12,8], 'plot_label': True, 'plot_std': True, 'unit': None, 'mean_plot_title': 'Mean of Ensemble of Zonal average', 'std_plot_title': 'Standard deviation of Ensemble of Zonal average', 'cbar_label': 'temperature in K', 'dpi': 300}.
Basic usage
The basic usage of this diagnostics is explained with working examples in the notebooks provided in notebooks/diagnostics/ensemble directory. Additionally, a detailed command line interface is also avaiable in src/aqua_diagnostics/ensemble directory.
Notebooks are stored in notebooks/ensemble:
Example Plots
Ensemble module provides output plots as PDF and PNG.
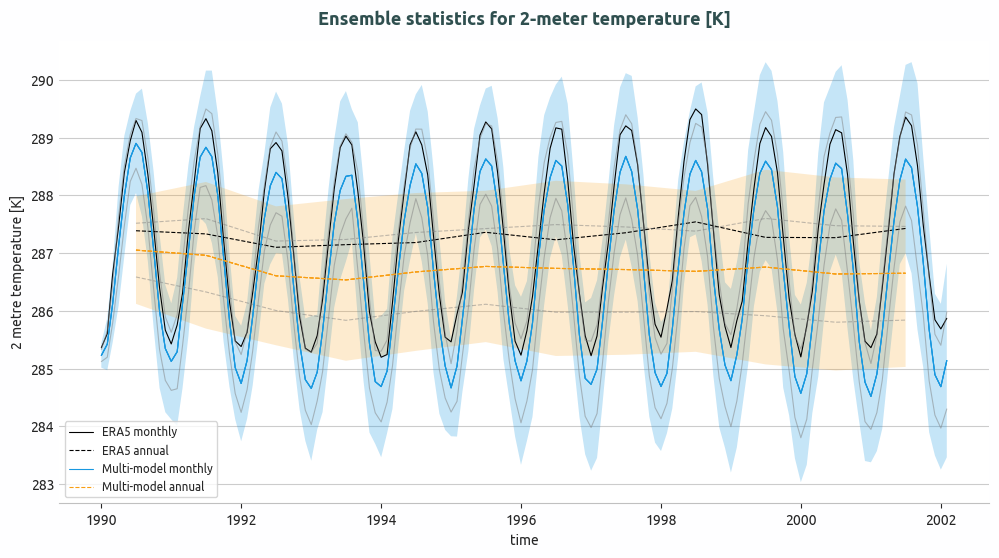
Ensemble of multi-model global monthly and annual timeseries and compared with ERA5 global monthly and annual average. Models considered as IFS-NEMO and IFS-FESM.
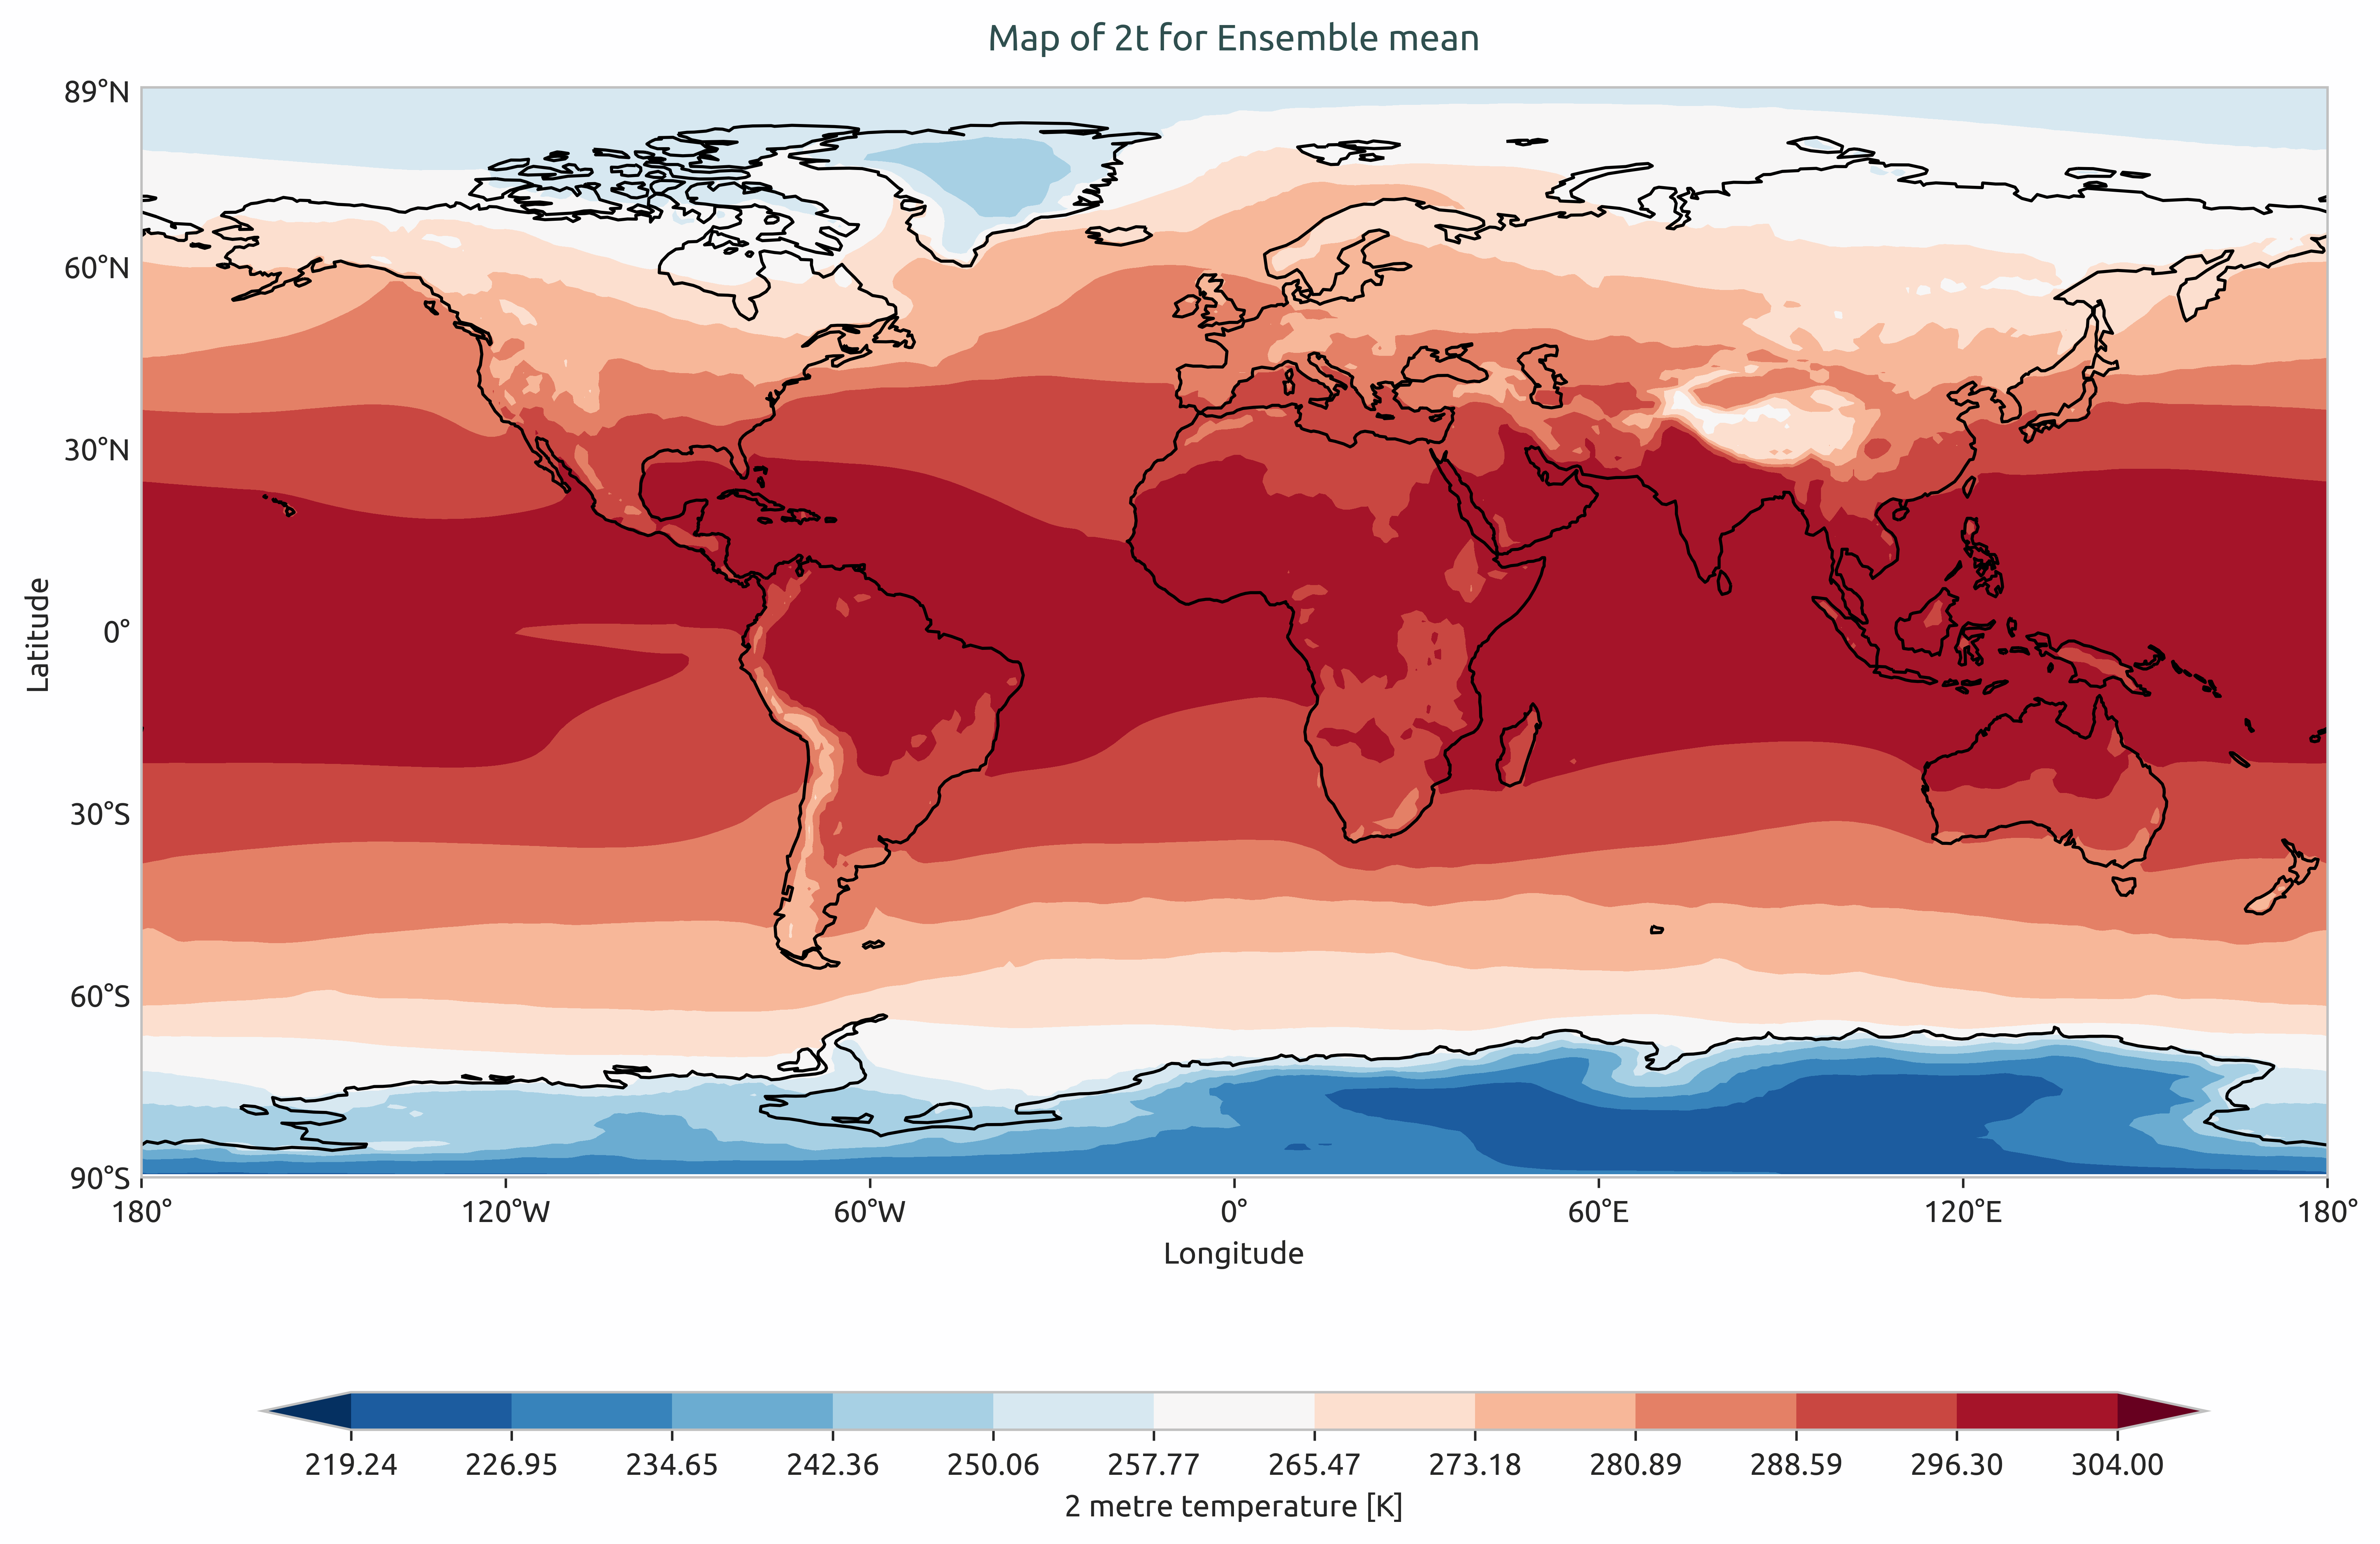
Ensemble mean of multi-model of global mean of 2-meter temperature. Models considered as IFS-NEMO and IFS-FESM.
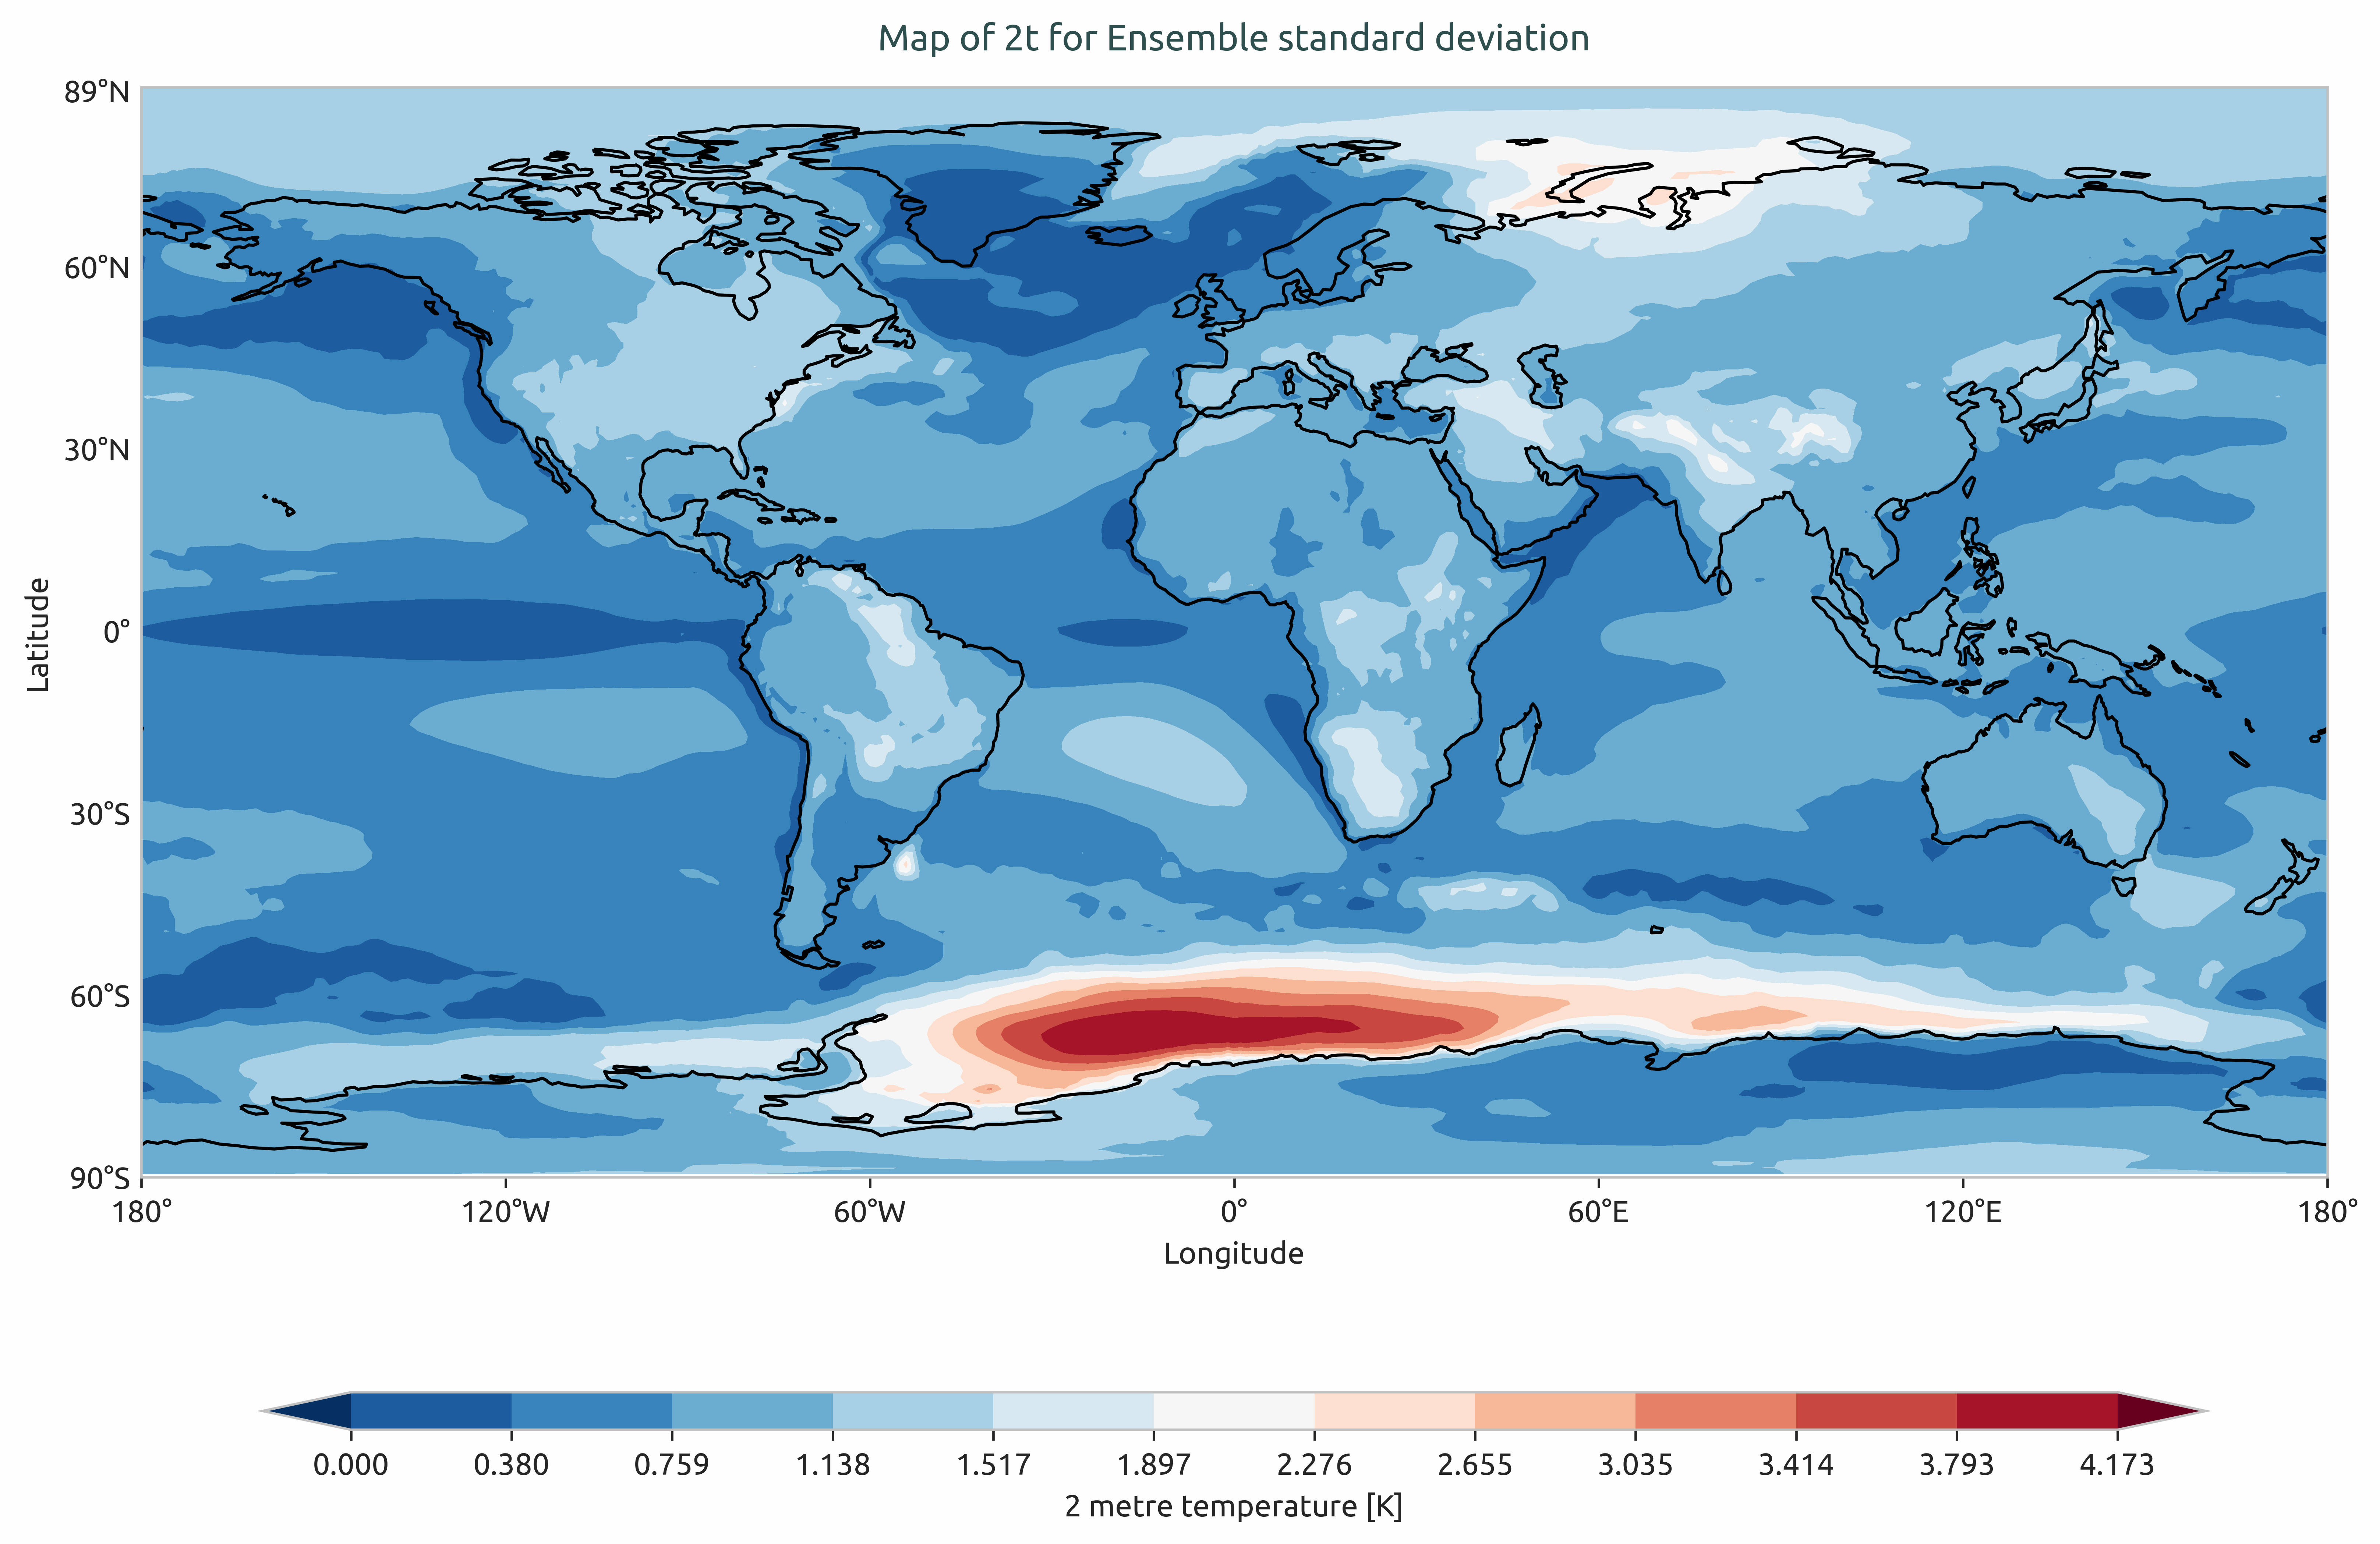
Ensemble standard devation of multi-model of the global mean of 2-meter temperature. Models considered as IFS-NEMO and IFS-FESM.
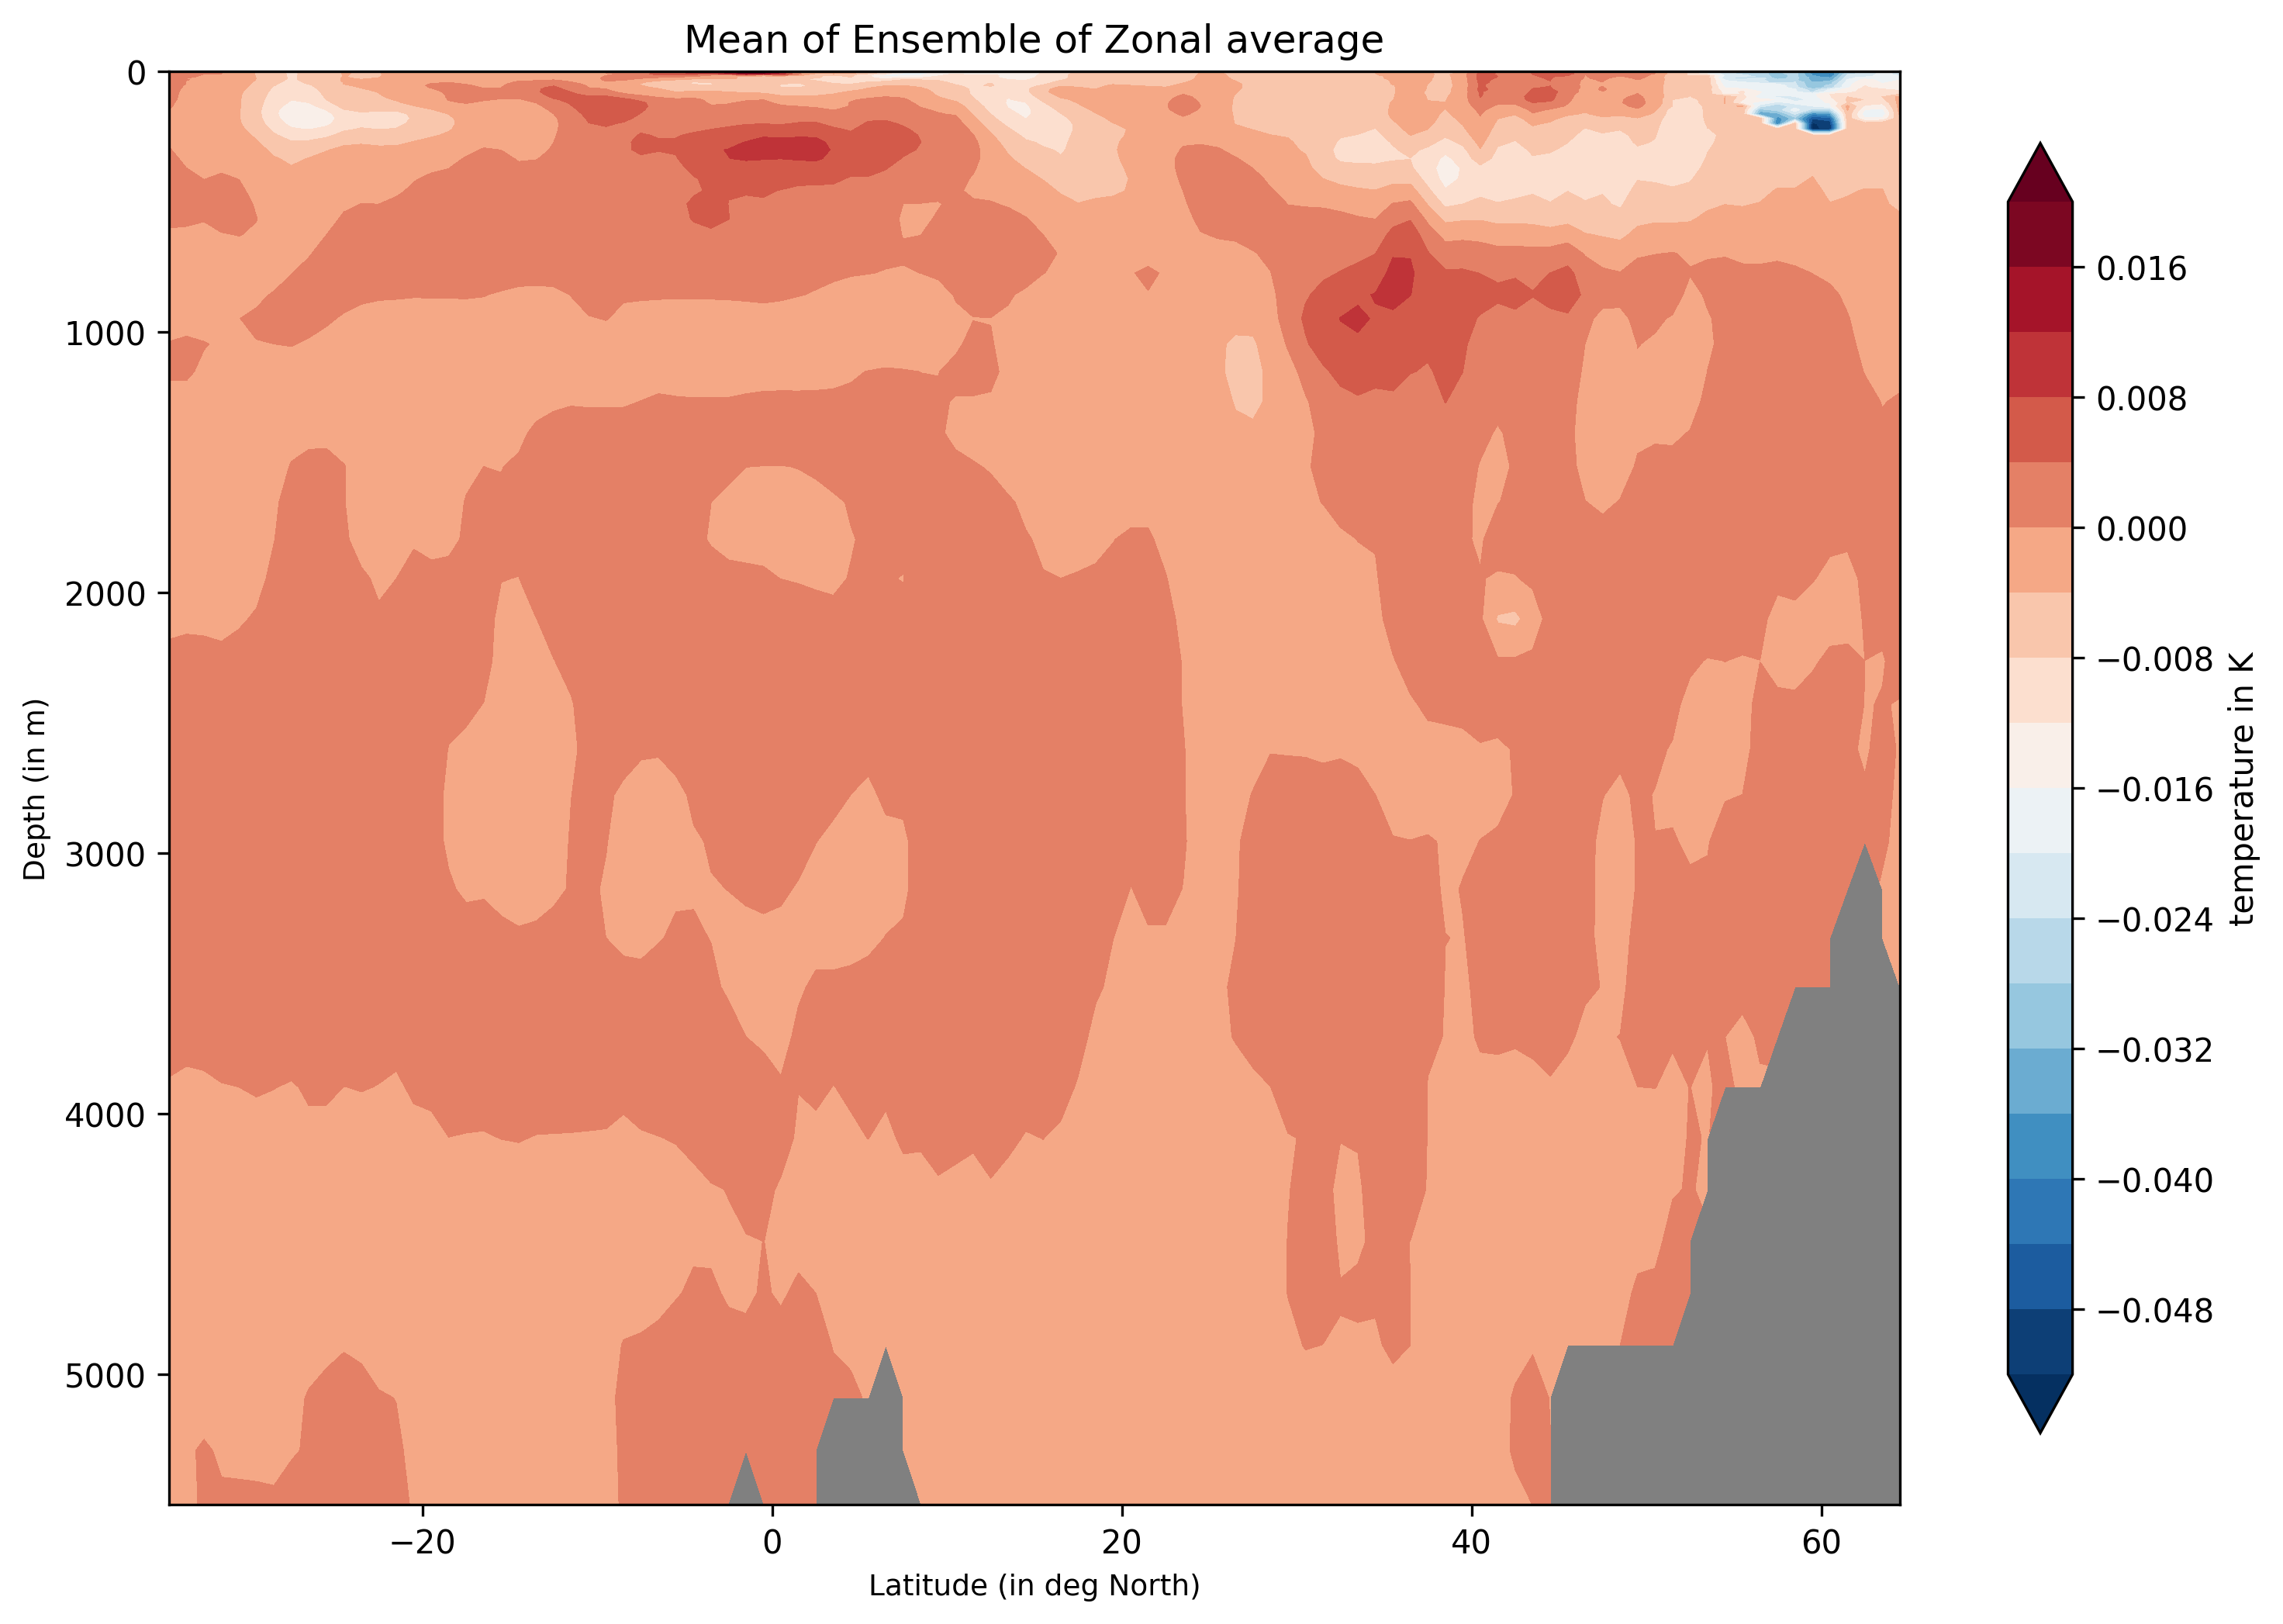
Ensemble-Zonal mean for average Time-mean sea water practical salinity for IFS-NEMO historical-1990.
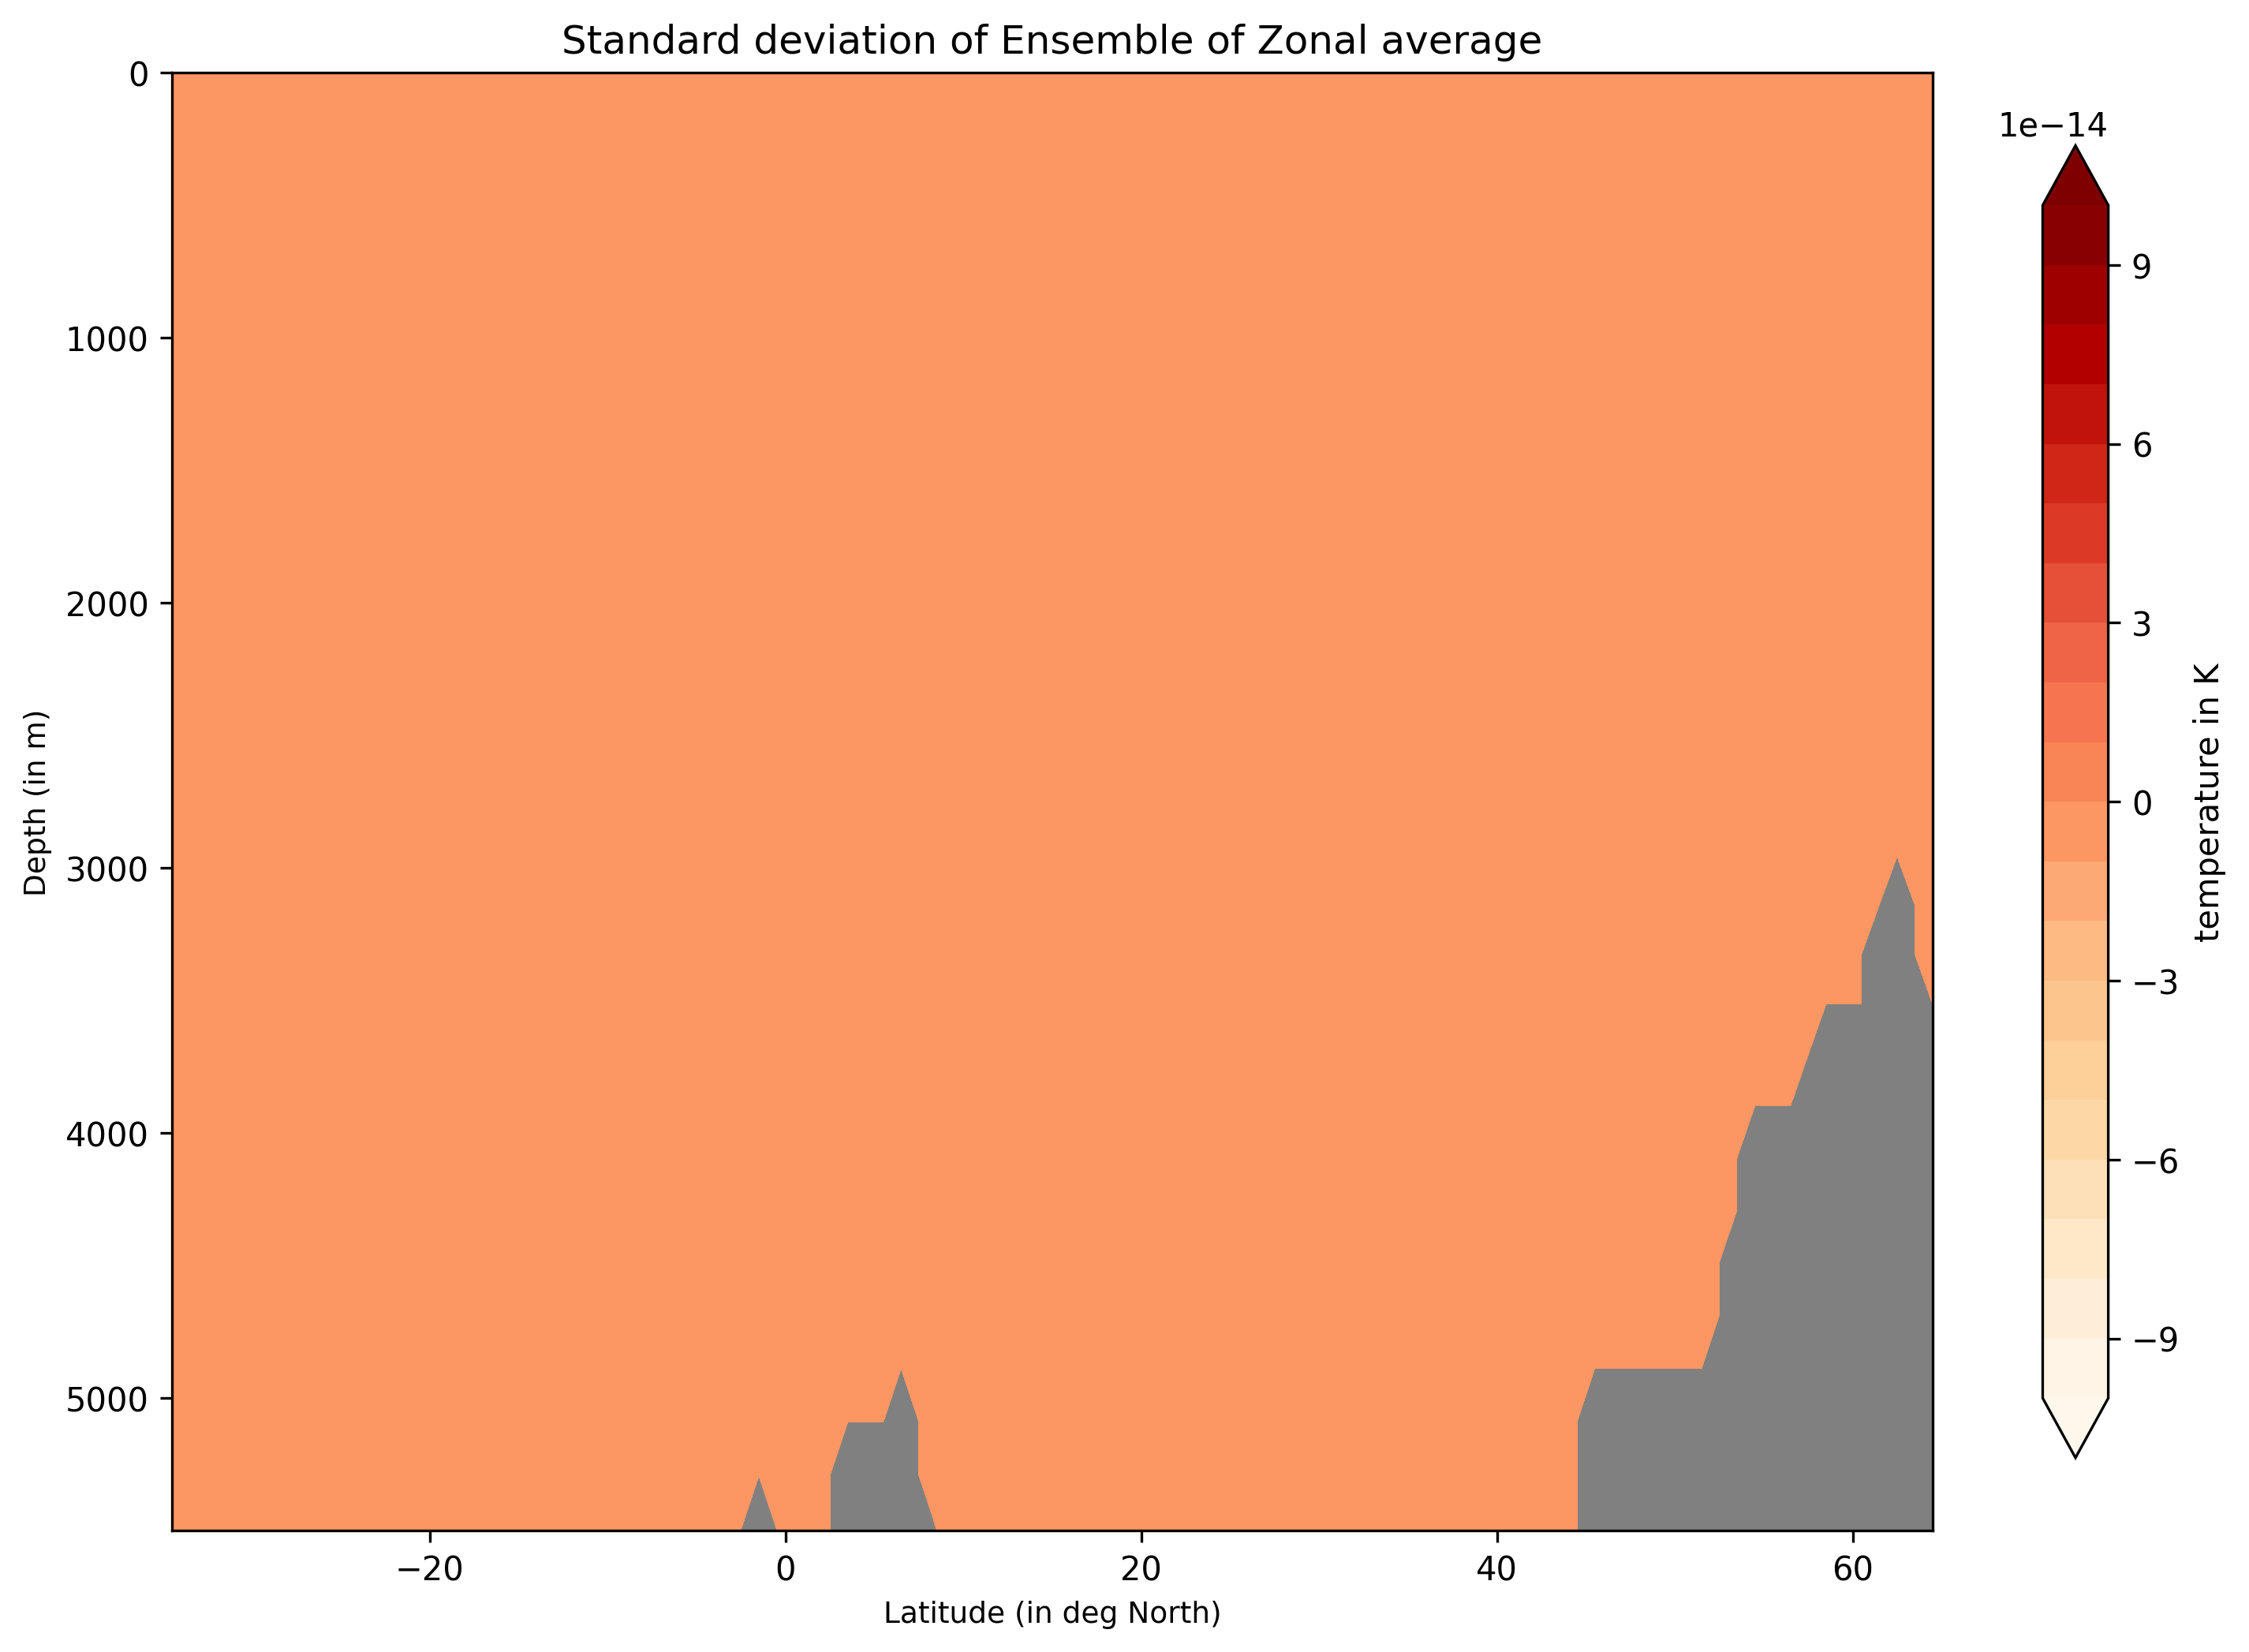
Ensemble-Zonal standard deviation for average Time-mean sea water practical salinity for IFS-NEMO historical-1990.
Detailed API
This section provides a detailed reference for the Application Programming Interface (API) of the ensemble diagnostic,
produced from the diagnostic function docstrings.
- class aqua.diagnostics.ensemble.EnsembleLatLon(var=None, dataset=None, catalog_list=None, model_list=None, exp_list=None, source_list=None, ensemble_dimension_name='ensemble', description=None, outputdir='./', loglevel='WARNING')
Bases:
BaseMixinA class to compute ensemble mean and standard deviation of a 2D (lon-lat) Dataset. Make sure that the dataset has correct lon-lat dimensions.
- Parameters:
var (str) – Variable name.
dataset – xarray Dataset composed of ensembles 2D lon-lat data, i.e., the individual Dataset (lon-lat) are concatenated along. a new dimension “ensemble”. This ensemble name can be changed.
catalog_list (str) – This variable defines the catalog list. The default is ‘None’. If None, the variable is assigned to ‘None_catalog’. In case of Multi-catalogs, the variable is assigned to ‘multi-catalog’.
model_list (str) – This variable defines the model list. The default is ‘None’. If None, the variable is assigned to ‘None_model’. In case of Multi-Model, the variable is assigned to ‘multi-model’.
exp_list (str) – This variable defines the exp list. The default is ‘None’. If None, the variable is assigned to ‘None_exp’. In case of Multi-Exp, the variable is assigned to ‘multi-exp’.
source_list (str) – This variable defines the source list. The default is ‘None’. If None, the variable is assigned to ‘None_source’. In case of Multi-Source, the variable is assigned to ‘multi-source’.
ensemble_dimension_name="ensemble" (str) – a default name given to the dimensions along with the individual Datasets were concatenated.
outputdir (str) – String input for output path.
description (str) – Description of the netcdf.
loglevel (str) – Log level. Default is “WARNING”.
- run()
A function to compute the mean and standard devivation of the input dataset It is import to make sure that the dim along which the mean is compute is correct. The default dim=”ensemble”.
- class aqua.diagnostics.ensemble.EnsembleTimeseries(var=None, hourly_data=None, daily_data=None, monthly_data=None, annual_data=None, catalog_list=None, model_list=None, exp_list=None, source_list=None, ensemble_dimension_name='ensemble', description=None, outputdir='./', loglevel='WARNING')
Bases:
BaseMixinThis class computes mean and standard deviation of the timeseries ensemble.
NOTE: The STD is computed Point-wise along the mean.
- Parameters:
var (str) – Variable name.
hourly_data – xarray Dataset of ensemble members of hourly timeseries. The ensemble memebers are concatenated along a new dimension “ensemble”.
daily_data – xarray Dataset of ensemble members of daily timeseries. The ensemble memebers are concatenated along a new dimension “ensemble”.
monthly_data – xarray Dataset of ensemble members of monthly timeseries. The ensemble memebers are concatenated along a new dimension “ensemble”.
annual_data – xarray Dataset of ensemble members of annual timeseries. The ensemble members are concatenated along the dimension “ensemble”
ensemble_dimension_name="ensemble" (str) – a default name given to the dimensions along with the individual Datasets were concatenated.
catalog_list (list) – list of catalog names.
model_list (list) – list of model names. This is mandotory.
exp_list (list) – list of experiment names.
source_list (list) – list of source list.
description (str) – Description of the netcdf.
outputdir (str) – String input for output path.
loglevel (str) – Log level. Default is “WARNING”.
- run()
A function to compute the mean and standard devivation of the input dataset It is import to make sure that the dim along which the mean is compute is correct. The default dim=”ensemble”. TODO: Test DASK’s .compute() function here.
- class aqua.diagnostics.ensemble.EnsembleZonal(var=None, dataset=None, catalog_list=None, model_list=None, exp_list=None, source_list=None, ensemble_dimension_name='ensemble', outputdir='./', loglevel='WARNING')
Bases:
BaseMixinA class to compute ensemble mean and standard deviation of the Zonal averages Make sure that the dataset has correct lev-lat dimensions.
- Parameters:
var (str) – Variable name.
dataset – xarray Dataset composed of ensembles 2D Zonal data, i.e., the individual Dataset (lev-lat) are concatenated along. a new dimension “ensemble”. This ensemble name can be changed.
catalog_list (str) – This variable defines the catalog list. The default is ‘None’. If None, the variable is assigned to ‘None_catalog’. In case of Multi-catalogs, the variable is assigned to ‘multi-catalog’.
model_list (str) – This variable defines the model list. The default is ‘None’. If None, the variable is assigned to ‘None_model’. In case of Multi-Model, the variable is assigned to ‘multi-model’.
exp_list (str) – This variable defines the exp list. The default is ‘None’. If None, the variable is assigned to ‘None_exp’. In case of Multi-Exp, the variable is assigned to ‘multi-exp’.
source_list (str) – This variable defines the source list. The default is ‘None’. If None, the variable is assigned to ‘None_source’. In case of Multi-Source, the variable is assigned to ‘multi-source’.
ensemble_dimension_name="ensemble" (str) – a default name given to the dimensions along with the individual Datasets were concatenated.
outputdir (str) – String input for output path.
loglevel (str) – Log level. Default is “WARNING”.
- run()
A function to compute the mean and standard devivation of the input dataset It is import to make sure that the dim along which the mean is compute is correct. The default dim=”ensemble”.
- class aqua.diagnostics.ensemble.PlotEnsembleLatLon(diagnostic_product: str = 'EnsembleLatLon', catalog_list: list[str] = None, model_list: list[str] = None, exp_list: list[str] = None, source_list: list[str] = None, region: str = None, save_pdf=True, save_png=True, var: str = None, dataset_mean=None, dataset_std=None, description=None, dpi=300, title_mean=None, title_std=None, vmin_mean=None, vmax_mean=None, vmin_std=None, vmax_std=None, proj=<Projected CRS: +proj=eqc +ellps=WGS84 +a=6378137.0 +lon_0=0.0 +to ...> Name: unknown Axis Info [cartesian]: - E[east]: Easting (unknown) - N[north]: Northing (unknown) - h[up]: Ellipsoidal height (metre) Area of Use: - undefined Coordinate Operation: - name: unknown - method: Equidistant Cylindrical Datum: Unknown based on WGS 84 ellipsoid - Ellipsoid: WGS 84 - Prime Meridian: Greenwich, transform_first=False, cyclic_lon=False, contour=True, coastlines=True, cbar_label=None, units=None, outputdir='./', log_level: str = 'WARNING')
Bases:
BaseMixinClass to plot the ensmeble lat-lon
- Parameters:
var (str) – Variable name.
diagnostic_name (str) – The name of the diagnostic. Default is ‘ensemble’. This will be used to configure the logger and the output files.
catalog_list (str) – This variable defines the catalog list. The default is ‘None’. If None, the variable is assigned to ‘None_catalog’. In case of Multi-catalogs, the variable is assigned to ‘multi-catalog’.
model_list (str) – This variable defines the model list. The default is ‘None’. If None, the variable is assigned to ‘None_model’. In case of Multi-Model, the variable is assigned to ‘multi-model’.
exp_list (str) – This variable defines the exp list. The default is ‘None’. If None, the variable is assigned to ‘None_exp’. In case of Multi-Exp, the variable is assigned to ‘multi-exp’.
source_list (str) – This variable defines the source list. The default is ‘None’. If None, the variable is assigned to ‘None_source’. In case of Multi-Source, the variable is assigned to ‘multi-source’.
ensemble_dimension_name="ensemble" (str) – a default name given to the dimensions along with the individual Datasets were concatenated.
data_mean – xarray.Dataset timeseries monthly mean
data_std – xarray.Dataset timeseries monthly std
outputdir (str) – String input for output path.
save_pdf (bool) – Default is True.
save_png (bool) – Default is True.
dpi (int) – Default is 300.
title (str) – Title for plot.
description (str) – specific for saving the plot.
loglevel (str) – Log level. Default is “WARNING”.
- plot()
This plots the ensemble mean and standard deviation of the ensemble statistics.
- Returns:
a dict of fig and ax for mean and STD return {‘mean_plot’: [fig1, ax1], ‘std_plot’: [fig2, ax2]}
- class aqua.diagnostics.ensemble.PlotEnsembleTimeseries(diagnostic_product: str = 'EnsembleTimeseries', catalog_list: list[str] = None, model_list: list[str] = None, exp_list: list[str] = None, source_list: list[str] = None, ref_catalog: str = None, ref_model: str = None, ref_exp: str = None, region: str = None, figure_size=[10, 5], save_pdf=True, save_png=True, var: str = None, hourly_data=None, hourly_data_mean=None, hourly_data_std=None, daily_data=None, daily_data_mean=None, daily_data_std=None, monthly_data=None, monthly_data_mean=None, monthly_data_std=None, annual_data=None, annual_data_mean=None, annual_data_std=None, ref_hourly_data=None, ref_daily_data=None, ref_monthly_data=None, ref_annual_data=None, plot_ensemble_members=True, description=None, title=None, outputdir='./', log_level: str = 'WARNING')
Bases:
BaseMixinClass to plot the ensmeble timeseries
- Parameters:
var (str) – Variable name.
diagnostic_name (str) – The name of the diagnostic. Default is ‘ensemble’. This will be used to configure the logger and the output files.
catalog_list (str) – This variable defines the catalog list. The default is ‘None’. If None, the variable is assigned to ‘None_catalog’. In case of Multi-catalogs, the variable is assigned to ‘multi-catalog’.
model_list (str) – This variable defines the model list. The default is ‘None’. If None, the variable is assigned to ‘None_model’. In case of Multi-Model, the variable is assigned to ‘multi-model’.
exp_list (str) – This variable defines the exp list. The default is ‘None’. If None, the variable is assigned to ‘None_exp’. In case of Multi-Exp, the variable is assigned to ‘multi-exp’.
source_list (str) – This variable defines the source list. The default is ‘None’. If None, the variable is assigned to ‘None_source’. In case of Multi-Source, the variable is assigned to ‘multi-source’.
ref_catalog (str) – This is specific to timeseries reference data catalog. Default is None.
ref_model (str) – This is specific to timeseries reference data model. Default is None.
ref_exp (str) – This is specific to timeseries reference data exp. Default is None.
ref_hourly_data – reference hourly timesereis xarray.Dataset. Default is None.
ref_daily_data – reference daily timeseries xarray.Dataset. Default is None.
ref_monthly_data – reference monthly timeseries xarray.Dataset. Default is None.
ref_annual_data – reference annual timeseries xarray.Dataset. Default is None.
hourly_data – xarray Dataset of ensemble members of hourly timeseries. The ensemble memebers are concatenated along a new dimension “ensemble”.
hourly_data_mean – None
hourly_data_std – None
daily_data – xarray Dataset of ensemble members of daily timeseries. The ensemble memebers are concatenated along a new dimension “ensemble”.
daily_data_mean – None
daily_data_std – None
monthly_data – xarray Dataset of ensemble members of monthly timeseries. The ensemble memebers are concatenated along a new dimension “ensemble”.
annual_data – xarray Dataset of ensemble members of annual timeseries. The ensemble members are concatenated along the dimension “ensemble”
ensemble_dimension_name="ensemble" (str) – a default name given to the dimensions along with the individual Datasets were concatenated.
monthly_data_mean – xarray.Dataset timeseries monthly mean
monthly_data_std – xarray.Dataset timeseries monthly std
annual_data_mean – xarray.Dataset timeseries annual mean
annual_data_std – xarray.Dataset timeseries annual std
outputdir (str) – String input for output path.
figure_size – figure_size can be changed. Default is None,
save_pdf (bool) – Default is True.
save_png (bool) – Default is True.
title (str) – Title for plot.
description (str) – specific for saving the plot.
loglevel (str) – Log level. Default is “WARNING”.
- plot()
This plots the ensemble mean and +/- 2 x standard deviation of the ensemble statistics around the ensemble mean. In this method, it is also possible to plot the individual ensemble members. It does not plots +/- 2 x STD for the referene.
- Returns:
fig, ax
NOTE: The STD is computed and plotted Point-wise along the mean.
- class aqua.diagnostics.ensemble.PlotEnsembleZonal(diagnostic_product: str = 'EnsembleZonal', catalog_list: list[str] = None, model_list: list[str] = None, exp_list: list[str] = None, source_list: list[str] = None, region: str = None, figure_size=(10, 8), save_pdf=True, save_png=True, var: str = None, dataset_mean=None, dataset_std=None, description=None, title_mean=None, title_std=None, cbar_label=None, units=None, ylim=(5500, 0), levels=20, cmap='RdBu_r', ylabel='Depth (in m)', xlabel='Latitude (in deg North)', outputdir='./', log_level: str = 'WARNING')
Bases:
BaseMixinInitialize the Base class. This class provides functions to assign names and save the outputs as pdf, png and netcdf.
- Parameters:
diagnostic_name (str) – The name of the diagnostic. Default is ‘ensemble’. This will be used to configure the logger and the output files.
diagnostic_product (str) – This is to define which class of the ensemble module is used. The default is ‘None’. Options are: ‘EnsembleTimeseries’, ‘EnsembleLatLon’, ‘EnsembleZonal’.
catalog_list (str) – This variable defines the catalog list. The default is ‘None’. If None, the variable is assigned to ‘None_catalog’. In case of Multi-catalogs, the variable is assigned to ‘multi-catalog’.
model_list (str) – This variable defines the model list. The default is ‘None’. If None, the variable is assigned to ‘None_model’. In case of Multi-Model, the variable is assigned to ‘multi-model’.
exp_list (str) – This variable defines the exp list. The default is ‘None’. If None, the variable is assigned to ‘None_exp’. In case of Multi-Exp, the variable is assigned to ‘multi-exp’.
source_list (str) – This variable defines the source list. The default is ‘None’. If None, the variable is assigned to ‘None_source’. In case of Multi-Source, the variable is assigned to ‘multi-source’.
ref_catalog (str) – This is specific to timeseries reference data catalog. Default is None.
ref_model (str) – This is specific to timeseries reference data model. Default is None.
ref_exp (str) – This is specific to timeseries reference data exp. Default is None.
region (str) – This is variable assigns region name. Default is None.
outputdir (str) – String input for output path. Default is ‘./’
log_level (str) – Default is set to “WARNING”
- plot()
This plots the ensemble mean and standard deviation of the ensemble statistics. To edit the default settings please call the method “edit_attributes”
- Returns:
a dict of fig and ax for mean and STD return {‘mean_plot’: [fig1, ax1], ‘std_plot’: [fig2, ax2]}
- aqua.diagnostics.ensemble.retrieve_merge_ensemble_data(variable: str = None, region: str = None, ens_dim: str = 'ensemble', model_names: list[str] = None, data_path_list: list[str] = None, catalog_list: list[str] = None, model_list: list[str] = None, exp_list: list[str] = None, source_list: list[str] = None, startdate: str = None, enddate: str = None, log_level: str = 'WARNING')
Retrieves, merges, and slices datasets based on specified models, experiments, sources, and time boundaries.
This function reads data for a given variable (variable) from multiple models, experiments, and sources, combines the datasets along the specified “ensemble” dimension along with their indices, and slices the merged dataset to the given start and end dates. The ens_dim can given any customized name for the ensemble dimension.
There are following two ways to load the datasets with function. a) with xarray.open_dataset b) with AQUA Reader class
- Parameters:
variable (str) – The variable to retrieve data. Defaults to None.
a) (In the case) –
data_path_list (list of str): list of paths for data to be loaded by xarray. model_names (list): Assign names to the variable lists. It is IMPORTANT
to assign names when calculating multi-model mean. This variable list will assign a name to each memeber.
b) (In the case) –
region (str): This variable is specific to the Zonal averages. Defaults to None. catalog_list (list): A list of AQUA catalog. Default to None. model_list (list): A list of model names. Each model corresponds to an
experiment and source in the exps and sources lists, respectively. Defaults to None.
- exp_list (list): A list of experiment names. Each experiment corresponds
to a model and source in the models and sources lists, respectively. Defaults to None.
- source_list (list): A list of data source names. Each source corresponds
to a model and experiment in the models and exps lists, respectively. Defaults to None.
datasets (Specific to the timeseries) –
- startdate (str or datetime): The start date for slicing the merged dataset.
If None is provided, the ensemble members are merged w.r.t to their time-interval. Defaults to None.
- enddate (str or datetime): The end date for slicing the merged dataset.
If None is provided, the ensemble members are merged w.r.t to their time-interval. Defaults to None.
- Returns:
- The merged dataset containing data from all specified models,
experiments, and sources, concatenated along ens_dim along with model name.
- Return type:
xarray.Dataset