Boxplots Diagnostic
Description
The Boxplots diagnostic computes and visualizes boxplots of spatial field means from climate model datasets, for one or multiple variables, over a specified time period. The diagnostic is designed with a class that analyzes a single model and generates the NetCDF files with the field means, and another class that produces the plots.
Classes
There is one class for the analysis and one for the plotting:
Boxplots: It retrieves the data and prepares it for plotting (e.g., regridding, unit conversion). It also handles the computation of field means, which are saved as class attributes and as NetCDF files.
PlotBoxplots: This class provides methods for plotting the boxplots of the field means computed by the Boxplots class.
File structure
The diagnostic is located in the
src/aqua_diagnostics/boxplotsdirectory, which contains both the source code and the command line interface (CLI) script.The configuration files are located in the
config/diagnostics/boxplotsdirectory and contain the default configuration for the diagnostic.Notebooks are available in the
notebooks/diagnostics/boxplotsdirectory and contain examples of how to use the diagnostic.
Input variables and datasets
The diagnostic can be used with any dataset that contains spatial fields. Multimodel datasets can be analyzed, and the diagnostic can be configured to compare against multiple reference datasets. All analyzed variables should share the same units to ensure meaningful comparisons; otherwise, the diagnostic will raise an error. The diagnostic is designed to work with data from the Data Reduction OPerator (DROP) of the AQUA project which, in this case, provides monthly data at a 1x1 degree resolution (Low Resolution Archive, LRA). A higher resolution is not necessary for this diagnostic.
Basic usage
The basic usage of this diagnostic is explained with a working example in the notebook provided in the notebooks/diagnostics/boxplots directory.
The basic structure of the analysis is the following:
from aqua.diagnostics import Boxplots, PlotBoxplots

variables = ['-tnlwrf', 'tnswrf']

boxplots = Boxplots(model='IFS-NEMO', exp='historical-1990', source='lra-r100-monthly')
boxplots.run(var=variables)

boxplots_era5 = Boxplots(model='ERA5', exp='era5', source='monthly')
boxplots_era5.run(var=variables)

boxplots_ceres = Boxplots(model='CERES', exp='ebaf-toa41', source='monthly', regrid='r100')
boxplots_ceres.run(var=variables)

datasets = boxplots.fldmeans
datasets_ref = [boxplots_ceres.fldmeans, boxplots_era5.fldmeans]

plot = PlotBoxplots(diagnostic='radiation')
plot.plot_boxplots(data=datasets, data_ref=datasets_ref, var=variables)
CLI usage
The diagnostic can be run from the command line interface (CLI) by running the following command:
cd $AQUA/src/aqua_diagnostics/boxplots
python cli_boxplots.py --config_file <path_to_config_file>
Additionally, the CLI can be run with the following optional arguments:
--config,-c: Path to the configuration file.--nworkers,-n: Number of workers to use for parallel processing.--cluster: Cluster to use for parallel processing. By default, a local cluster is used.--loglevel,-l: Logging level. Default isWARNING.--catalog: Catalog to use for the analysis. Can be defined in the config file.--model: Model to analyse. Can be defined in the config file.--exp: Experiment to analyse. Can be defined in the config file.--source: Source to analyse. Can be defined in the config file.--outputdir: Output directory for the plots.
Config file structure
The configuration file is a YAML file that contains the details on the dataset to analyse or use as reference, the output directory and the diagnostic settings. Most of the settings are common to all the diagnostics (see Diagnostics configuration files). Here we describe only the specific settings for the boxplots diagnostic.
boxplots: a block (nested in thediagnosticsblock) containing options for the Boxplots diagnostic. Variable-specific parameters override the defaults.run: enable/disable the diagnostic.diagnostic_name: name of the diagnostic.boxplotsby default, but can be changed when the boxplots CLI is invoked within anotherrecipediagnostic, as is currently done forRadiation.variables: list of variables to analyse.
diagnostics:
  boxplots:
    run: true
    diagnostic_name: 'radiation'
    variables: ['-tnlwrf', 'tnswrf']
Output
The diagnostic produces a single plot:
A boxplot showing the distribution of the field means for each variable across the specified models and reference datasets. If reference datasets are provided and the
anomaliesoption is set toTrue, the boxplot will show anomalies with respect to the mean of the selected reference dataset. With theadd_mean_lineoption set toTrue, dashed lines indicating the absolute mean values will be added to the boxplots. Plots are saved in both PDF and PNG format.
Example plots
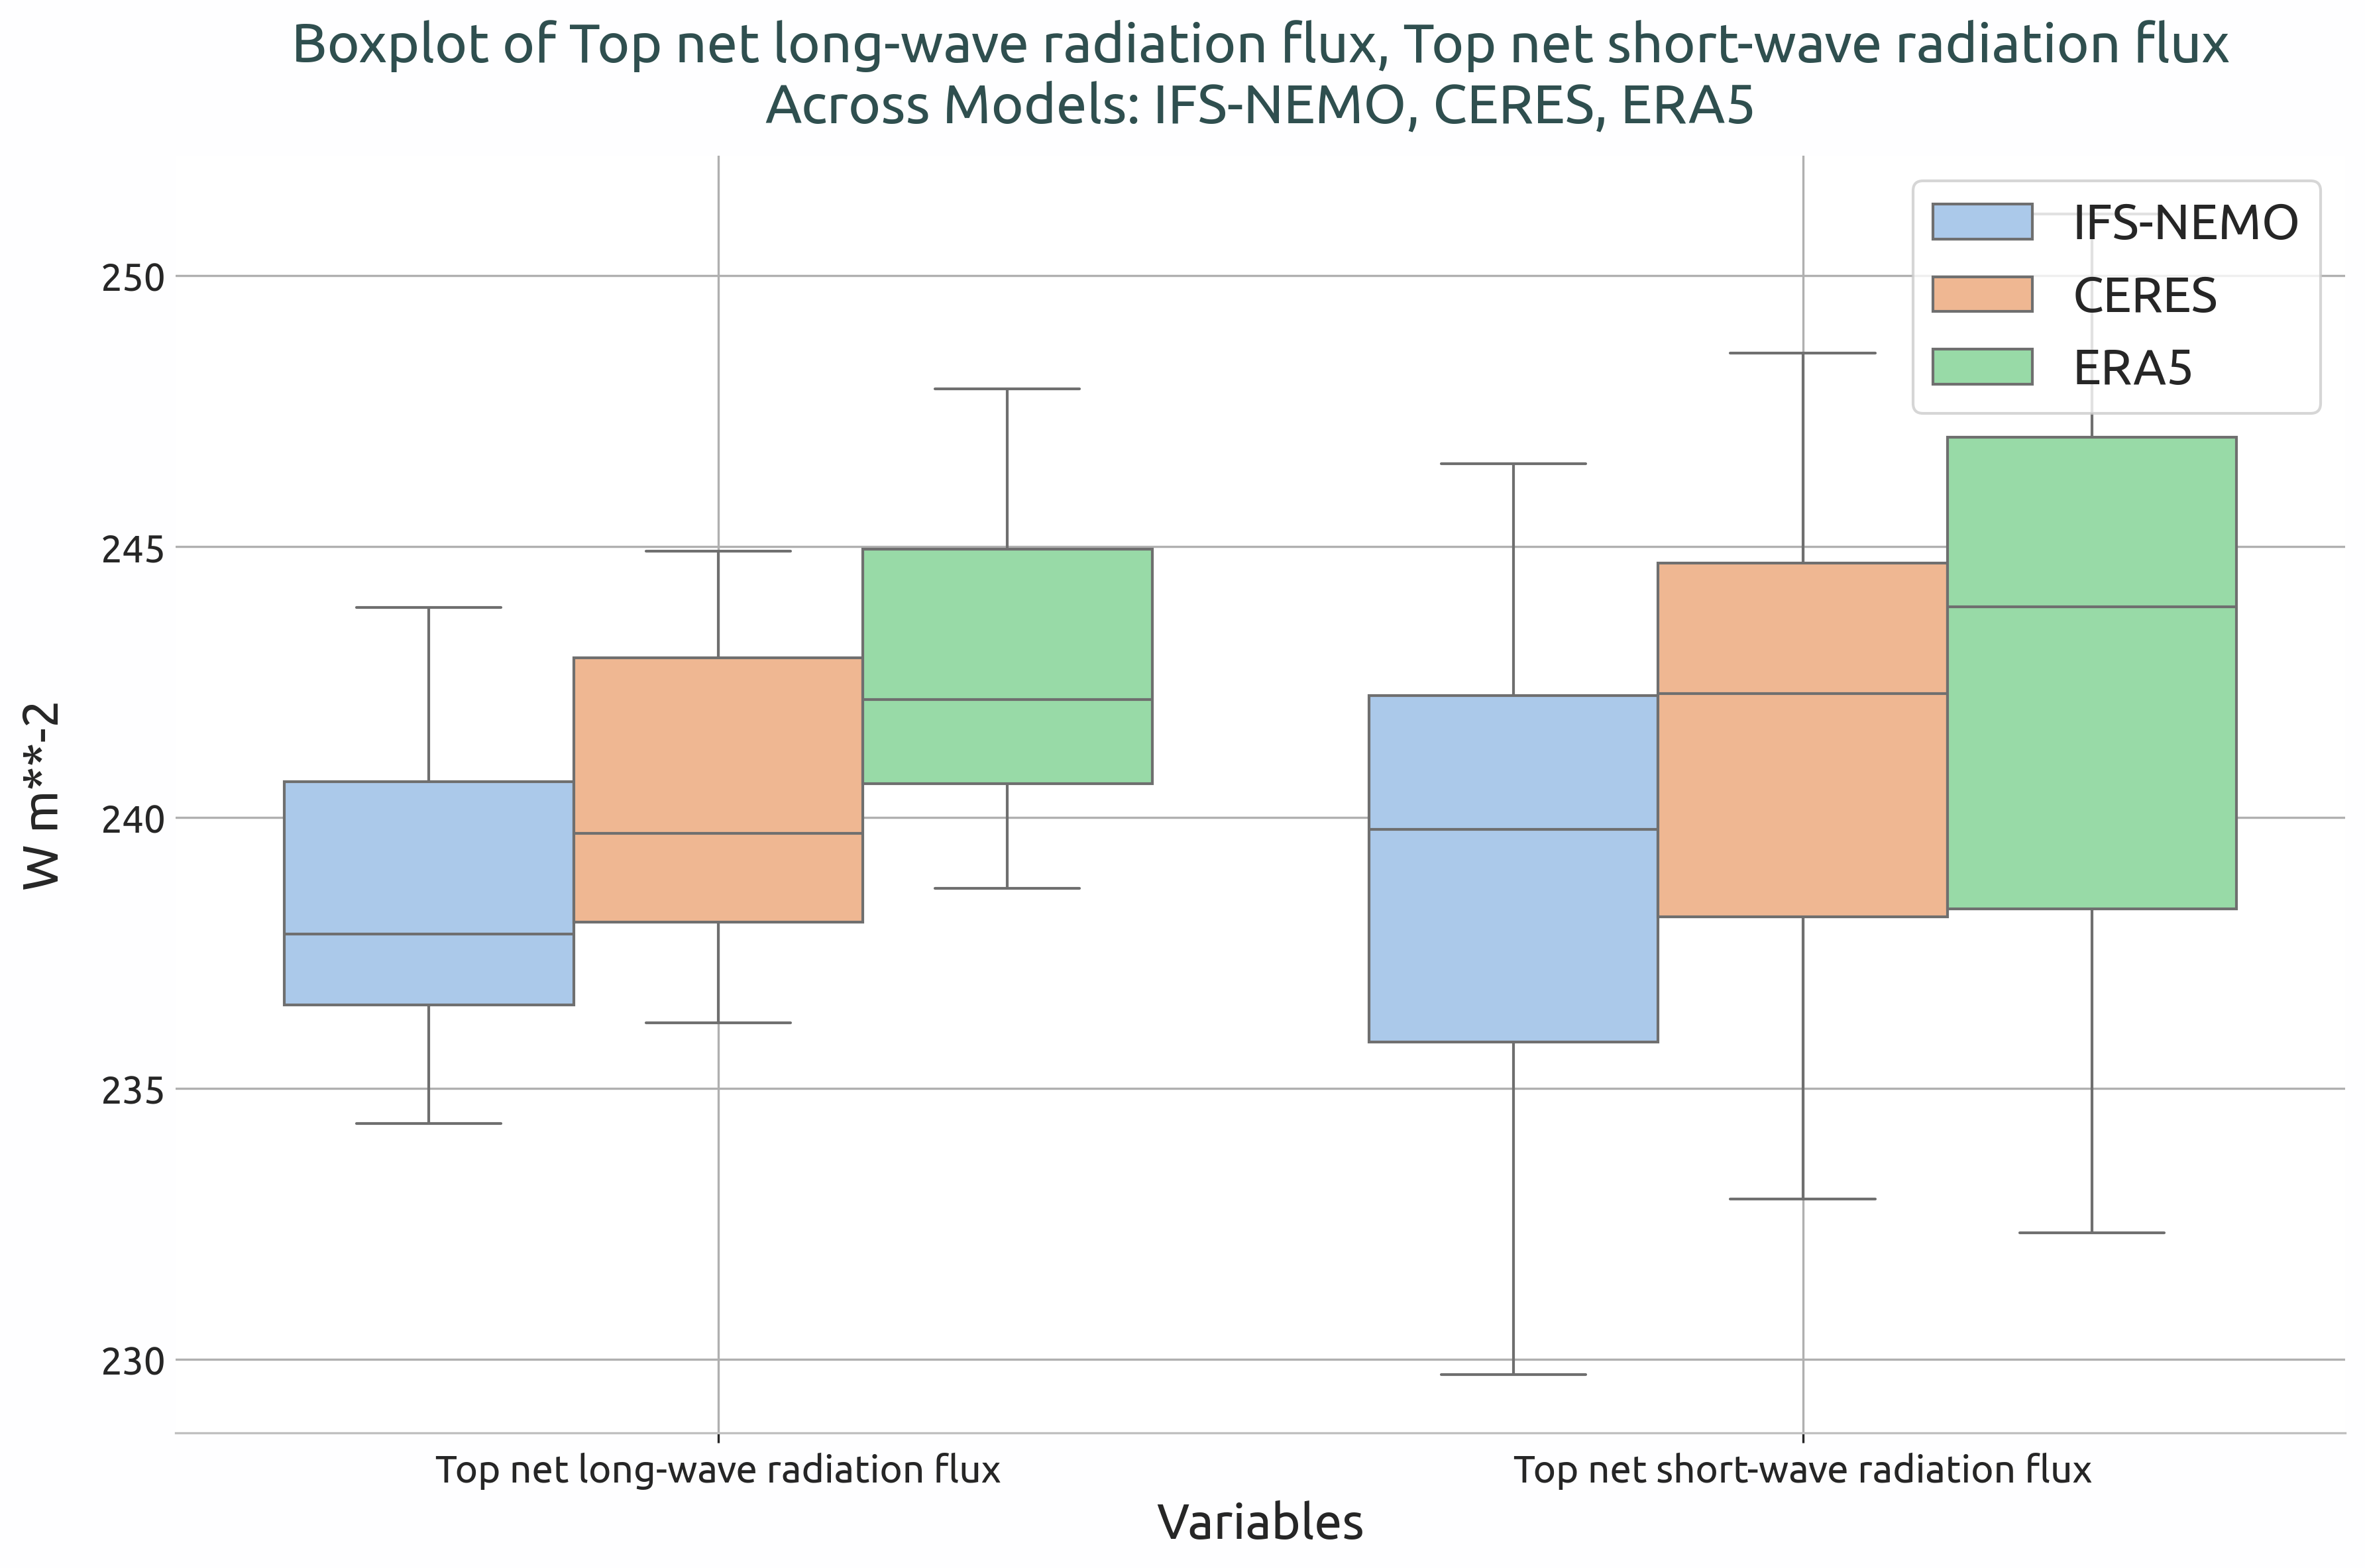
Box plot showing the globally averaged incoming and outgoing TOA radiation of IFS-NEMO historical-1990 with respect to ERA5 and CERES climatologies
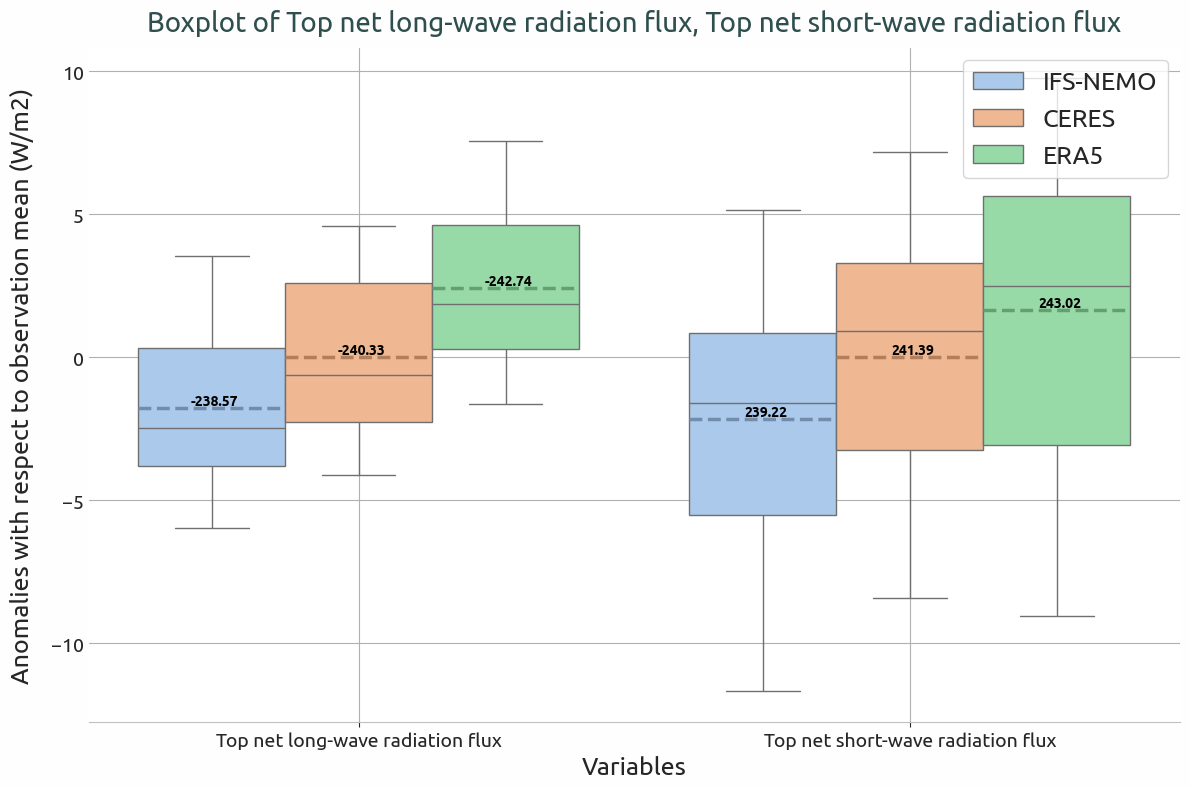
Box plot showing the anomalies of the globally averaged incoming and outgoing TOA radiation of IFS-NEMO historical-1990 with respect to the ERA5 climatology. The dashed lines indicates the absolute mean values.
Available demo notebooks
Notebooks are stored in notebooks/diagnostics/boxplots:
Detailed API
This section provides a detailed reference for the Application Programming Interface (API) of the Boxplots diagnostic, produced from the diagnostic function docstrings.