Teleconnections
Description
The teleconnections diagnostic is a set of tool to compute the most relevant teleconnections. NAO (North Atlantic Oscillation), ENSO (El Niño Southern Oscillation) and MJO (Madden-Julian Oscillation) are the teleconnections currently implemented. The diagnostic is build to evaluate the teleconnections indices and to compute regression and correlation maps with respect to the teleconnection index.
Note
MJO is currently missing a command line interface and it is not operational yet.
Classes
There are three classes to compute the netCDF files:
NAO: a class that computes the NAO index based on the mean sea level pressure (msl) variable with the station based method, and computes the regression and correlation maps with respect to the NAO index.
ENSO: a class that computes the ENSO index based on the sea surface temperature (tos) variable with the Nino3.4 region and computes the regression and correlation maps with respect to the ENSO index.
MJO: a class that allows to compute the MJO Hovmoeller plots based on the top net thermal radiation flux (tnlwrf) variable.
There are three other classes to produce the plots:
PlotNAO: a class that ingests xarrays and produces the NAO index time series and the regression and correlation maps.
PlotENSO: a class that ingests xarrays and produces the ENSO index time series and the regression and correlation maps.
PlotMJO: a class that ingests xarrays and produces the MJO Hovmoeller plots.
File structure
The diagnostic is located in the
src/aqua_diagnostics/teleconnectionsdirectory, which contains the source code and the command line interface (CLI) script.The configuration files are located in the
config/diagnostics/teleconnectionsdirectory and contain the default configuration for the diagnostic.Notebooks are available in the
notebooks/diagnostics/teleconnectionsdirectory and contain examples of how to use the diagnostic.Interface files to specify custom regions or other variable names for the index evaluation are available in the
config/diagnostics/teleconnections/interfacedirectory.
Note
A command line to evaluate with the bootstrap method the concordance maps of regression and correlation is available in the cli_bootstrap.py file.
This is not included in any automatic run of the diagnostic because it is a time-consuming process.
Input variables and datasets
By default, the diagnostics compare against the ERA5 dataset, with the index evaluated over the entire available period (1940 to present).
The necessary variables for the default evaluation are: - NAO: Sea level pressure (msl). - ENSO: Sea surface temperature (tos). - MJO: Top net thermal radiation flux (tnlwrf).
Other variables can be used for the regression and correlation maps.
CLI usage
The diagnostic can be run from the command line interface (CLI) by running the following command:
cd $AQUA/src/aqua_diagnostics/teleconnections
python cli_teleconnections.py --config <path_to_config_file>
Three configuration files are provided and run when executing the aqua-analysis (see AQUA analysis wrapper). Two configuration files are for atmospheric and oceanic teleconnections.
Additionally the CLI can be run with the following optional arguments:
--config,-c: Path to the configuration file.--nworkers,-n: Number of workers to use for parallel processing.--cluster: Cluster to use for parallel processing. By default a local cluster is used.--loglevel,-l: Logging level. Default isWARNING.--catalog: Catalog to use for the analysis. It can be defined in the config file.--model: Model to analyse. It can be defined in the config file.--exp: Experiment to analyse. It can be defined in the config file.--source: Source to analyse. It can be defined in the config file.--outputdir: Output directory for the plots.
Config file structure
The configuration file is a YAML file that contains the details on the dataset to analyse or use as reference, the output directory and the diagnostic settings. Most of the settings are common to all the diagnostics (see Diagnostics configuration files). Here we describe only the specific settings for the teleconnections diagnostic.
teleconnections: a block, nested in thediagnosticsblock, that contains the details required for the teleconnections.It allows to specify which teleconnections to run, the months window for the rolling mean, the seasons to consider, and the color bar range for the plots. It contains the following blocks:
NAO: a block, nested in theteleconnectionsblock, that contains the details required for the NAO teleconnection.ENSO: a block, nested in theteleconnectionsblock, that contains the details required for the ENSO teleconnection.
diagnostics:
    teleconnections:
        NAO:
            run: true
            months_window: 3
            seasons: ['DJF']
            cbar_range: [-5, 5]
        ENSO:
            run: true
            months_window: 3
            seasons: ['annual']
            cbar_range: [-2, 2]
Output
The diagnostic produces the following outputs:
NAO: North Atlantic Oscillation index, regression and correlation maps.
ENSO: El Niño Southern Oscillation index, regression and correlation maps.
MJO: Madden-Julian Oscillation Hovmoeller plots of the Mean top net thermal radiation flux variable.
All these outputs can be stored both as images (pdf format) and as netCDF files. If a reference dataset is provided, the automatic maps consist of contour lines for the model regression map and filled contour map for the difference between the model and the reference regression map.
Example Plots
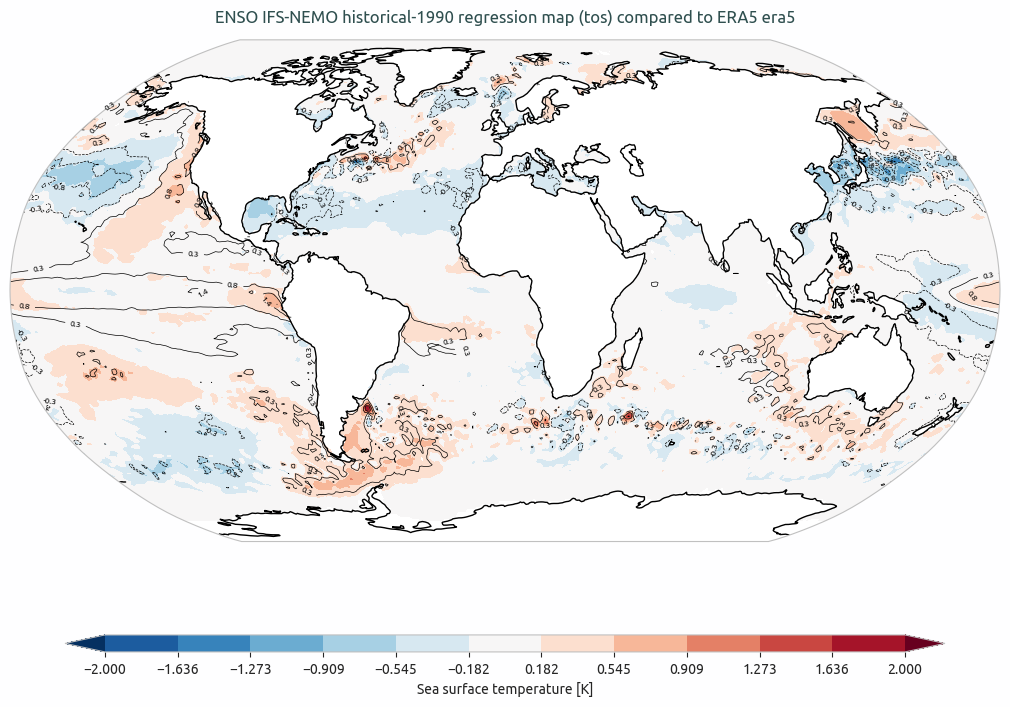
ENSO IFS-NEMO ssp370 regression map (avg_tos) compared to ERA5. The contour lines are the model regression map and the filled contour map is the difference between the model and the reference regression map (ERA5).
Available demo notebooks
Detailed API
This section provides a detailed reference for the Application Programming Interface (API) of the Teleconnections diagnostic, produced from the diagnostic function docstrings.