Ensemble Statistics
Description
The Ensemble module is a tool to perform uncertainty quantification and visualising the ensemble statistics namely, mean and standard deviation.
It is also possible to calculate the weighted mean and standard deviation in case of multi-model ensemble.
This module contains three main classes namely, EnsembleTimeseries, EnsembleLatLon and EnsembleZonal.
Additionally, this module also contains three supporting plotting classes namely, PlotEnsembleTimeseries, PlotEnsembleLatLon and PlotEnsembleZonal.
The EnsembleTimeseries class takes 1D xarray.Dataset timeseries as input and performs following functionalities:
- Computes ensemble mean and standard deviation (Point-wise along time axis) for monthly and annual timeseries.
The PlotEnsembleTimeseries class takes 1D xarray.Dataset timeseries as input and performs the following functionalities:
- Plots the ensemble-mean and 2x ensemble-std ± ensemble-mean along the given timeseries.
- Note that the standard deviation is Point-wise along time axis.
- A reference timeseries can also be plotted.
The EnsembleLatLon class takes 2D LatLon xarray.Dataset as input and performs the following functionalities:
- Compute ensemble mean and standard deviation for 2D Maps.
The PlotEnsembleLatLon class takes 2D LatLon xarray.Dataset as input and performs the following functionalities:
- Plots the ensemble mean and standard deviation separately on two different maps.
The EnsembleZonal class take zonal-averages Lev-Lon xarray.Dataset as input and performs the following functionalities:
- Computes ensemble mean and standard deviation of the given input.
The PlotEnsembleZonal class take zonal-averages Lev-Lon xarray.Dataset as input and performs the following functionalities:
- Plots the ensemble mean and standard deviation of the computed statistics.
Structure
ensembleTimeseries.py: contains theEnsembleTimeseriesclass.plot_ensemble_timeseries.py: contains thePlotEnsembleTimeseriesclass.ensembleLatLon.py: contains theEnsembleLatLonclass.plot_ensemble_latlon.py: contains thePlotEnsembleLatLon.pyclass.ensembleZonal.py: contains theEnsembleZonalclass.plot_ensemble_zonal.py: contains thePlotEnsembleLatLon.pyclass.cli_multi_model_timeseries_ensemble: the command line interfance (CLI) script to run the ensemble-timeseries1Ddiagnostic (mulit-model).cli_single_model_timeseries_ensemble: the command line interfance (CLI) script to run the ensemble-timeseries1Ddiagnostic (single-model-ensemble).cli_global_2D_ensemble.py: the command line interfance (CLI) script to run the ensemble-2D-maps inLat-Londiagnostic.cli_zonal_ensemble.py: the command line interfance (CLI) script to run the ensemble-zonalLev-Londiagnostic.util.py: contains thereader_retrieve_and_merge,merge_from_data_filesandcompute_statisticsfunctions.base.py: contains the base class which contains functions for saving the output as png, pdf and netcdf.config/diagnostics/ensemble/config_global_2D_ensemble.yaml: config file forcli_global_2D_ensemble.py.config/diagnostics/ensemble/config_multi_model_timeseries_ensemble.yaml: config file forensembleTimeseries.py.config/diagnostics/ensemble/config_single_model_timeseries_ensemble.yaml: config file forensembleTimeseries.py.config/diagnostics/ensemble/config_zonalmean_ensemble.yaml: config file forensembleZonal.py.
Input variables
In order to use the Ensemble module, a pre-processing step is required. To load and to merge the input data via Reader class use aqua.diagnostics.ensemble.util.reader_retrieve_and_merge. Additional functionality of this module is to load and merge using the list of paths of data via merge_from_data_files. In this step one has to merge all the given 1D timeseries, 2D Lat-Lon Map and Zonal-averages Lev-Lon for EnsembleTimeseries, EnsembleLatLon and EnsembleZonal along a pesudo-dimension, respectively. The default dimension is simply named as ensemble and can be changed. One can load the data directly as xarray.Dataset or can use the aqua Reader class. For example loading and merging a 2D maps ensemble into an xarray.Dataset:
import glob
from  aqua.diagnostics import merge_from_data_files

file_list = glob.glob('/work/ab0995/a270260/pre_computed_aqua_analysis/*/historical-1990/atmglobalmean/netcdf/atmglobalmean.statistics_maps.2t.*_historical-1990.nc')
file_list.sort()
ens_dataset = merge_from_data_files(
    variable='2t',
    model_names= ['IFS-FESOM', 'IFS-NEMO'],
    data_path_list=file_list,
    log_level = "WARNING",
    ens_dim="ensemble",
)
A second method:
from  aqua.diagnostics import reader_retrieve_and_merge

ens_dataset = reader_retrieve_and_merge(
    variable='2t',
    catalog_list=['nextgems4', 'climatedt-phase1'],
    models_catalog_list=['IFS-FESOM', 'IFS-NEMO'],
    exps_catalog_list=['historical-1990', 'historical-1990'],
    sources_catalog_list=['aqua-atmglobalmean', 'aqua-atmglobalmean'],
    log_level="WARNING",
    ens_dim="ensemble",
)
Ensemble computation
The ensemble statistics is performed on merged 1D timesereies by EnsembleTimeseries, 2D map by EnsembleLatLon, and zonal Lev-Lon by EnsembleZonal classes. Note that in the current version we provide point-wise ensemble mean and standard-deviation.
from aqua.diagnostics import EnsembleTimeseries

# Check if we need monthly and annual time variables
ts = EnsembleTimeseries(
    var=variable,
    model_list=['IFS-FESOM', 'IFS-NEMO'],
    monthly_data=mon_model_dataset,
    annual_data=ann_model_dataset,
    outputdir='./',
    loglevel='WARNING',
)

# Compute statistics and save the results as netcdf
ts.run()
Ensemble Plotting
The default values for the plotting fuction has been already set as default values. These values can also be by simply defining a python dictionary e.g., in the case of the EnsembleTimeseries,
plot_options = {'plot_ensemble_members': True, 'ensemble_label': 'Multi-model', 'plot_title': 'Ensemble statistics for 2-meter temperature [K]', 'ref_label': 'ERA5', 'figure_size': [12,6]}.
For EnsembleLatLon,
plot_options = {'figure_size': [15,14], 'cbar_label': '2-meter temperature in K','mean_plot_title': 'Map of 2t for Ensemble Multi-Model mean', 'std_plot_title': 'Map of 2t for Ensemble Multi-Model standard deviation'}.
For EnsembleZonal,
plot_options = {'figure_size': [12,8], 'plot_label': True, 'plot_std': True, 'unit': None, 'mean_plot_title': 'Mean of Ensemble of Zonal average', 'std_plot_title': 'Standard deviation of Ensemble of Zonal average', 'cbar_label': 'temperature in K', 'dpi': 300}.
from aqua.diagnostics import PlotEnsembleTimeseries
# PlotEnsembleTimeseries class
plot_class_arguments = {
    "model_list": ['IFS-FESOM', 'IFS-NEMO'],
    "ref_model": 'ERA5',
}

plot_arguments = {
    "var": variable,
    "save_pdf": True,
    "save_png": True,
    "plot_ensemble_members": True,
    "monthly_data": ts.monthly_data,
    "monthly_data_mean": ts.monthly_data_mean,
    "monthly_data_std": ts.monthly_data_std,
    "annual_data": ts.annual_data,
    "annual_data_mean": ts.annual_data_mean,
    "annual_data_std": ts.annual_data_std,
    "ref_monthly_data": mon_ref_data,
    "ref_annual_data": ann_ref_data,}

ensemble_plot = ts_plot.plot(**plot_arguments)


ts_plot = PlotEnsembleTimeseries(
    **plot_class_arguments,
    loglevel='WARNING',
)
Ensemble module provides output plots as PDF and PNG.
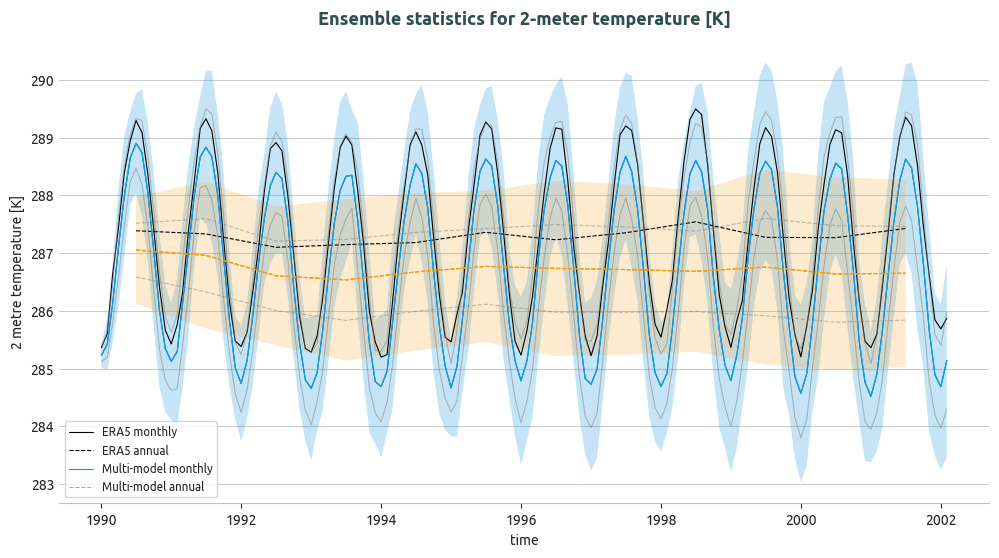
Ensemble of multi-model global monthly and annual timeseries and compared with ERA5 global monthly and annual average. Models considered as IFS-NEMO and IFS-FESOM.
Basic usage
The basic usage of this diagnostics is explained with working examples in the notebooks provided in notebooks/diagnostics/ensemble directory. Additionally, a detailed command line interface is also avaiable in src/aqua_diagnostics/ensemble directory.
Notebooks are stored in notebooks/ensemble:
ensemble_timeseries.ipynb <https://github.com/DestinE-Climate-DT/AQUA/blob/main/notebooks/diagnostics/ensemble/ensemble_timeseries.ipynb>_ensemble_global_2D.ipynb <https://github.com/DestinE-Climate-DT/AQUA/blob/main/notebooks/diagnostics/ensemble/ensemble_global_2D.ipynb>_ensemble_zonalaverage.ipynb <https://github.com/DestinE-Climate-DT/AQUA/blob/main/notebooks/diagnostics/ensemble/ensemble_zonalaverage.ipynb>_
Example Plots
Other example of ensemble module provides output plots as PDF and PNG.
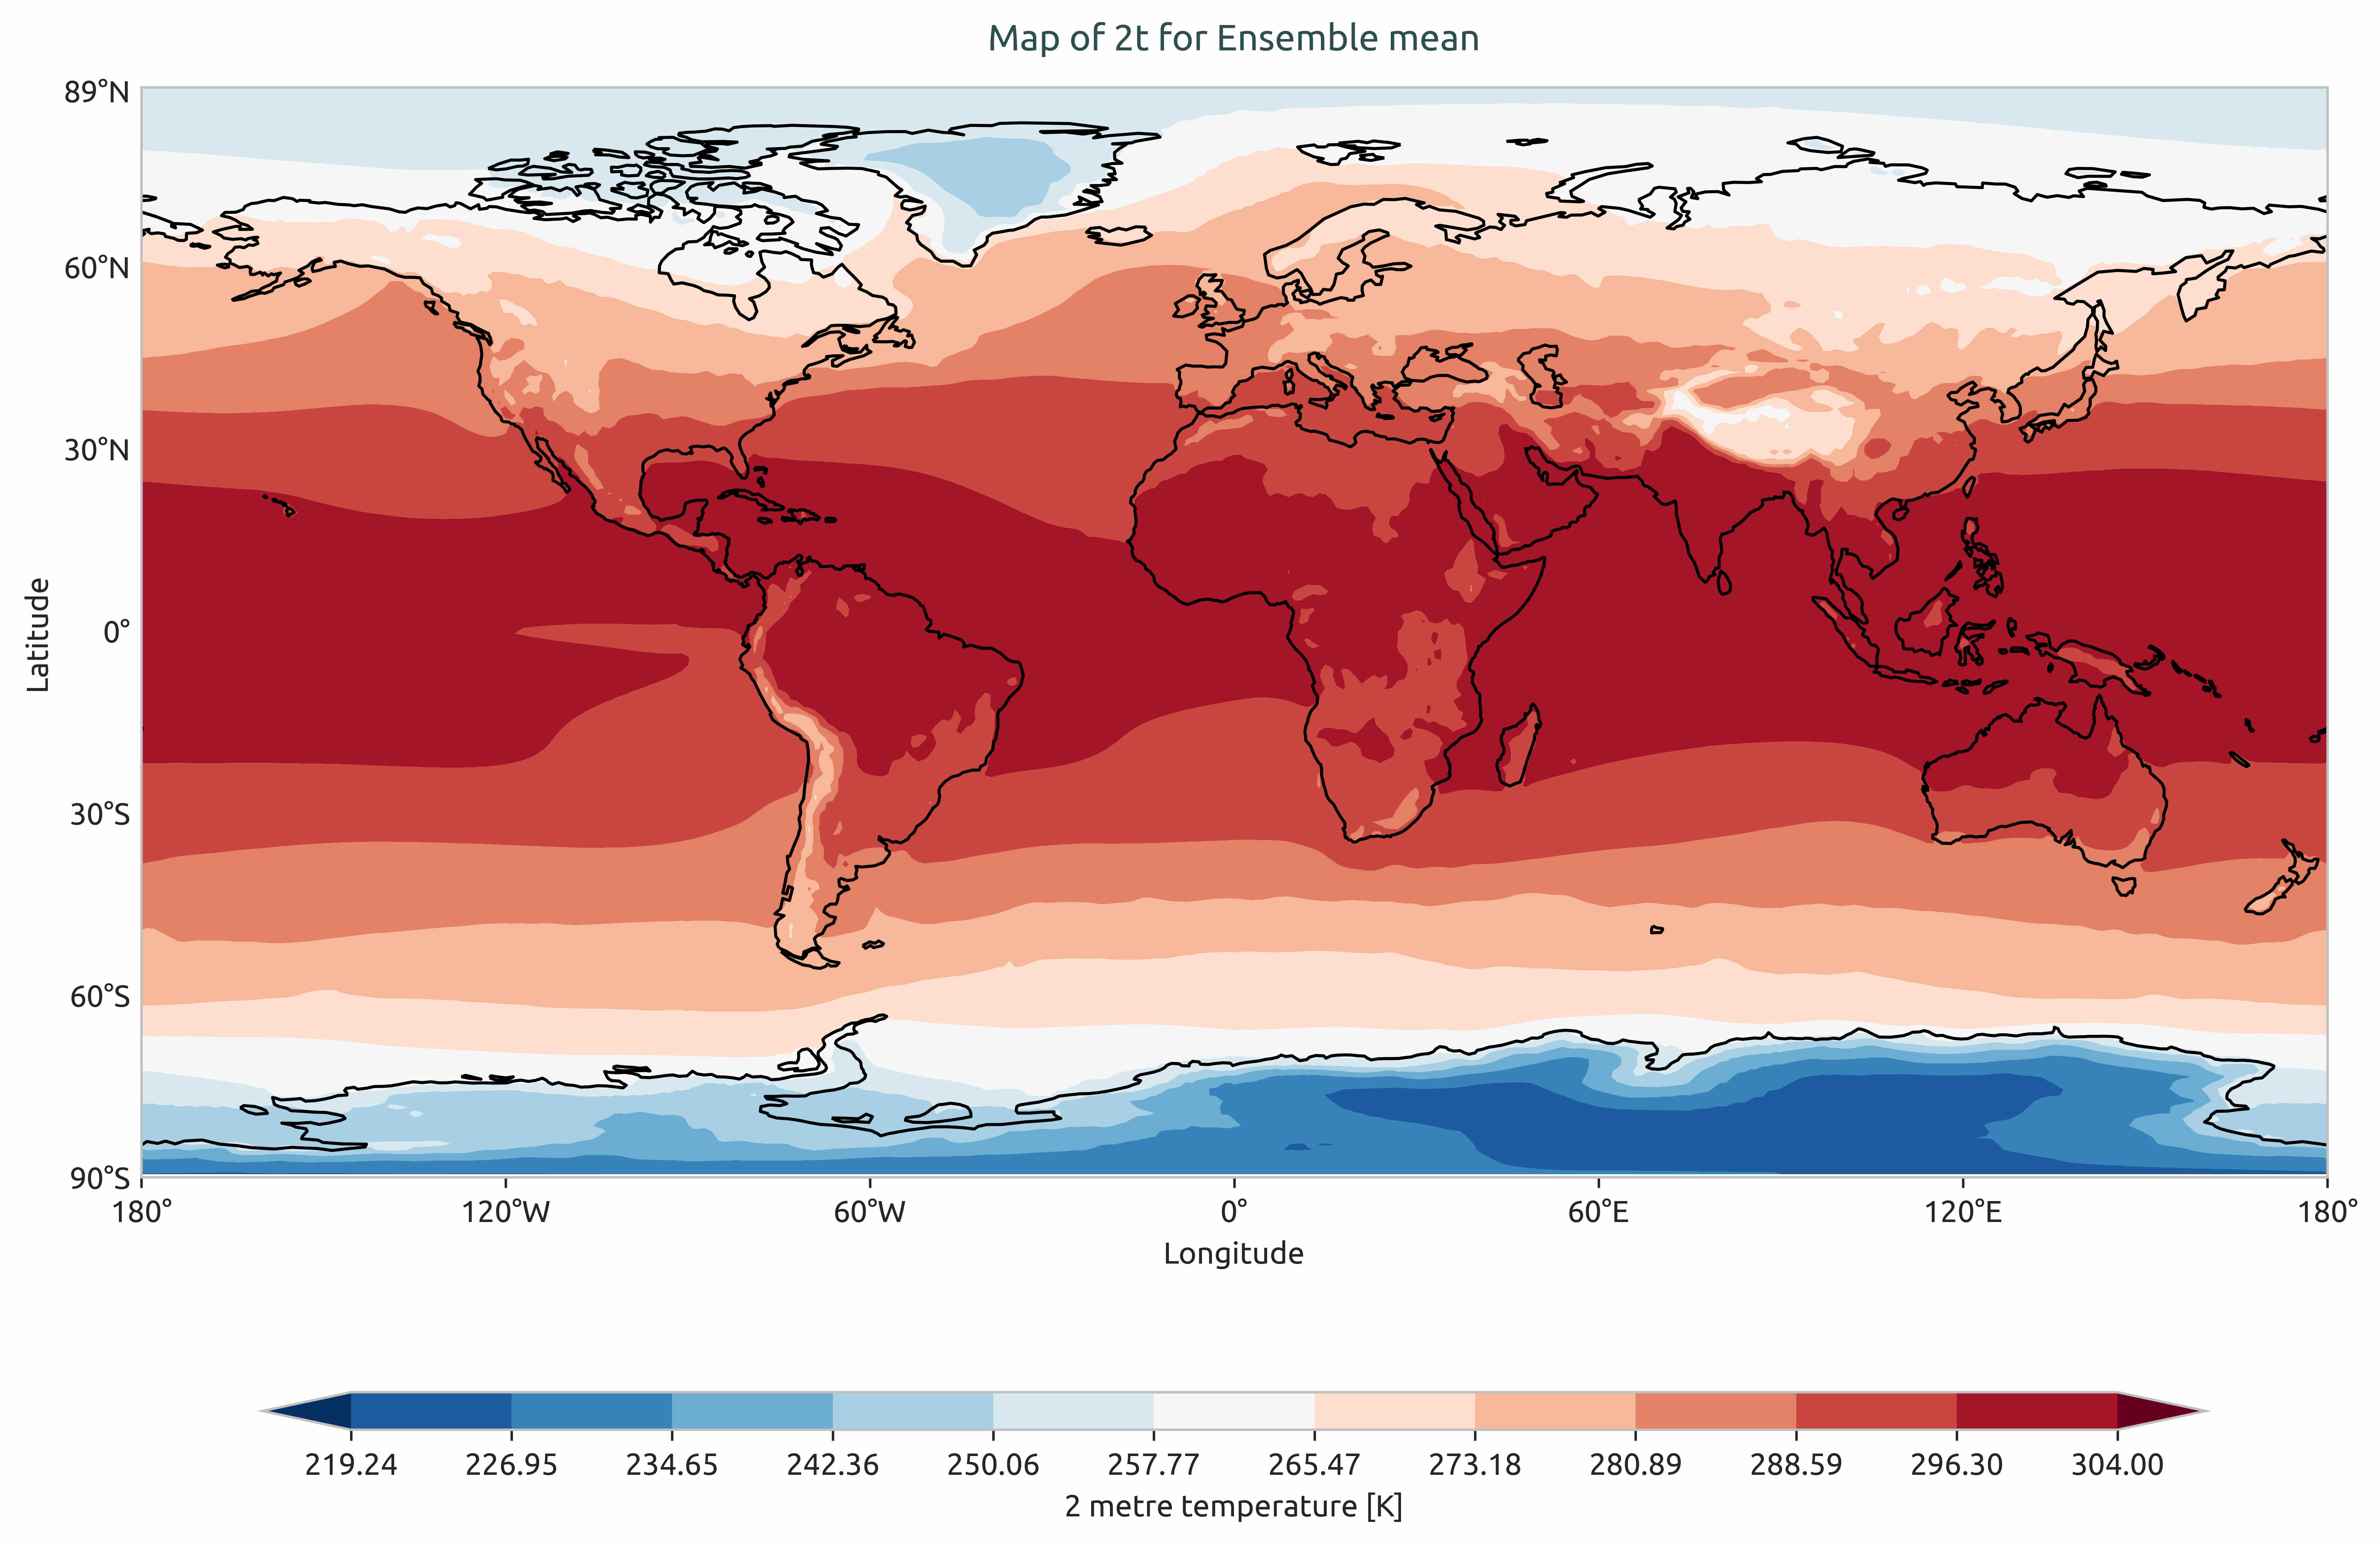
Ensemble mean of multi-model of global mean of 2-meter temperature. Models considered as IFS-NEMO and IFS-FESOM.
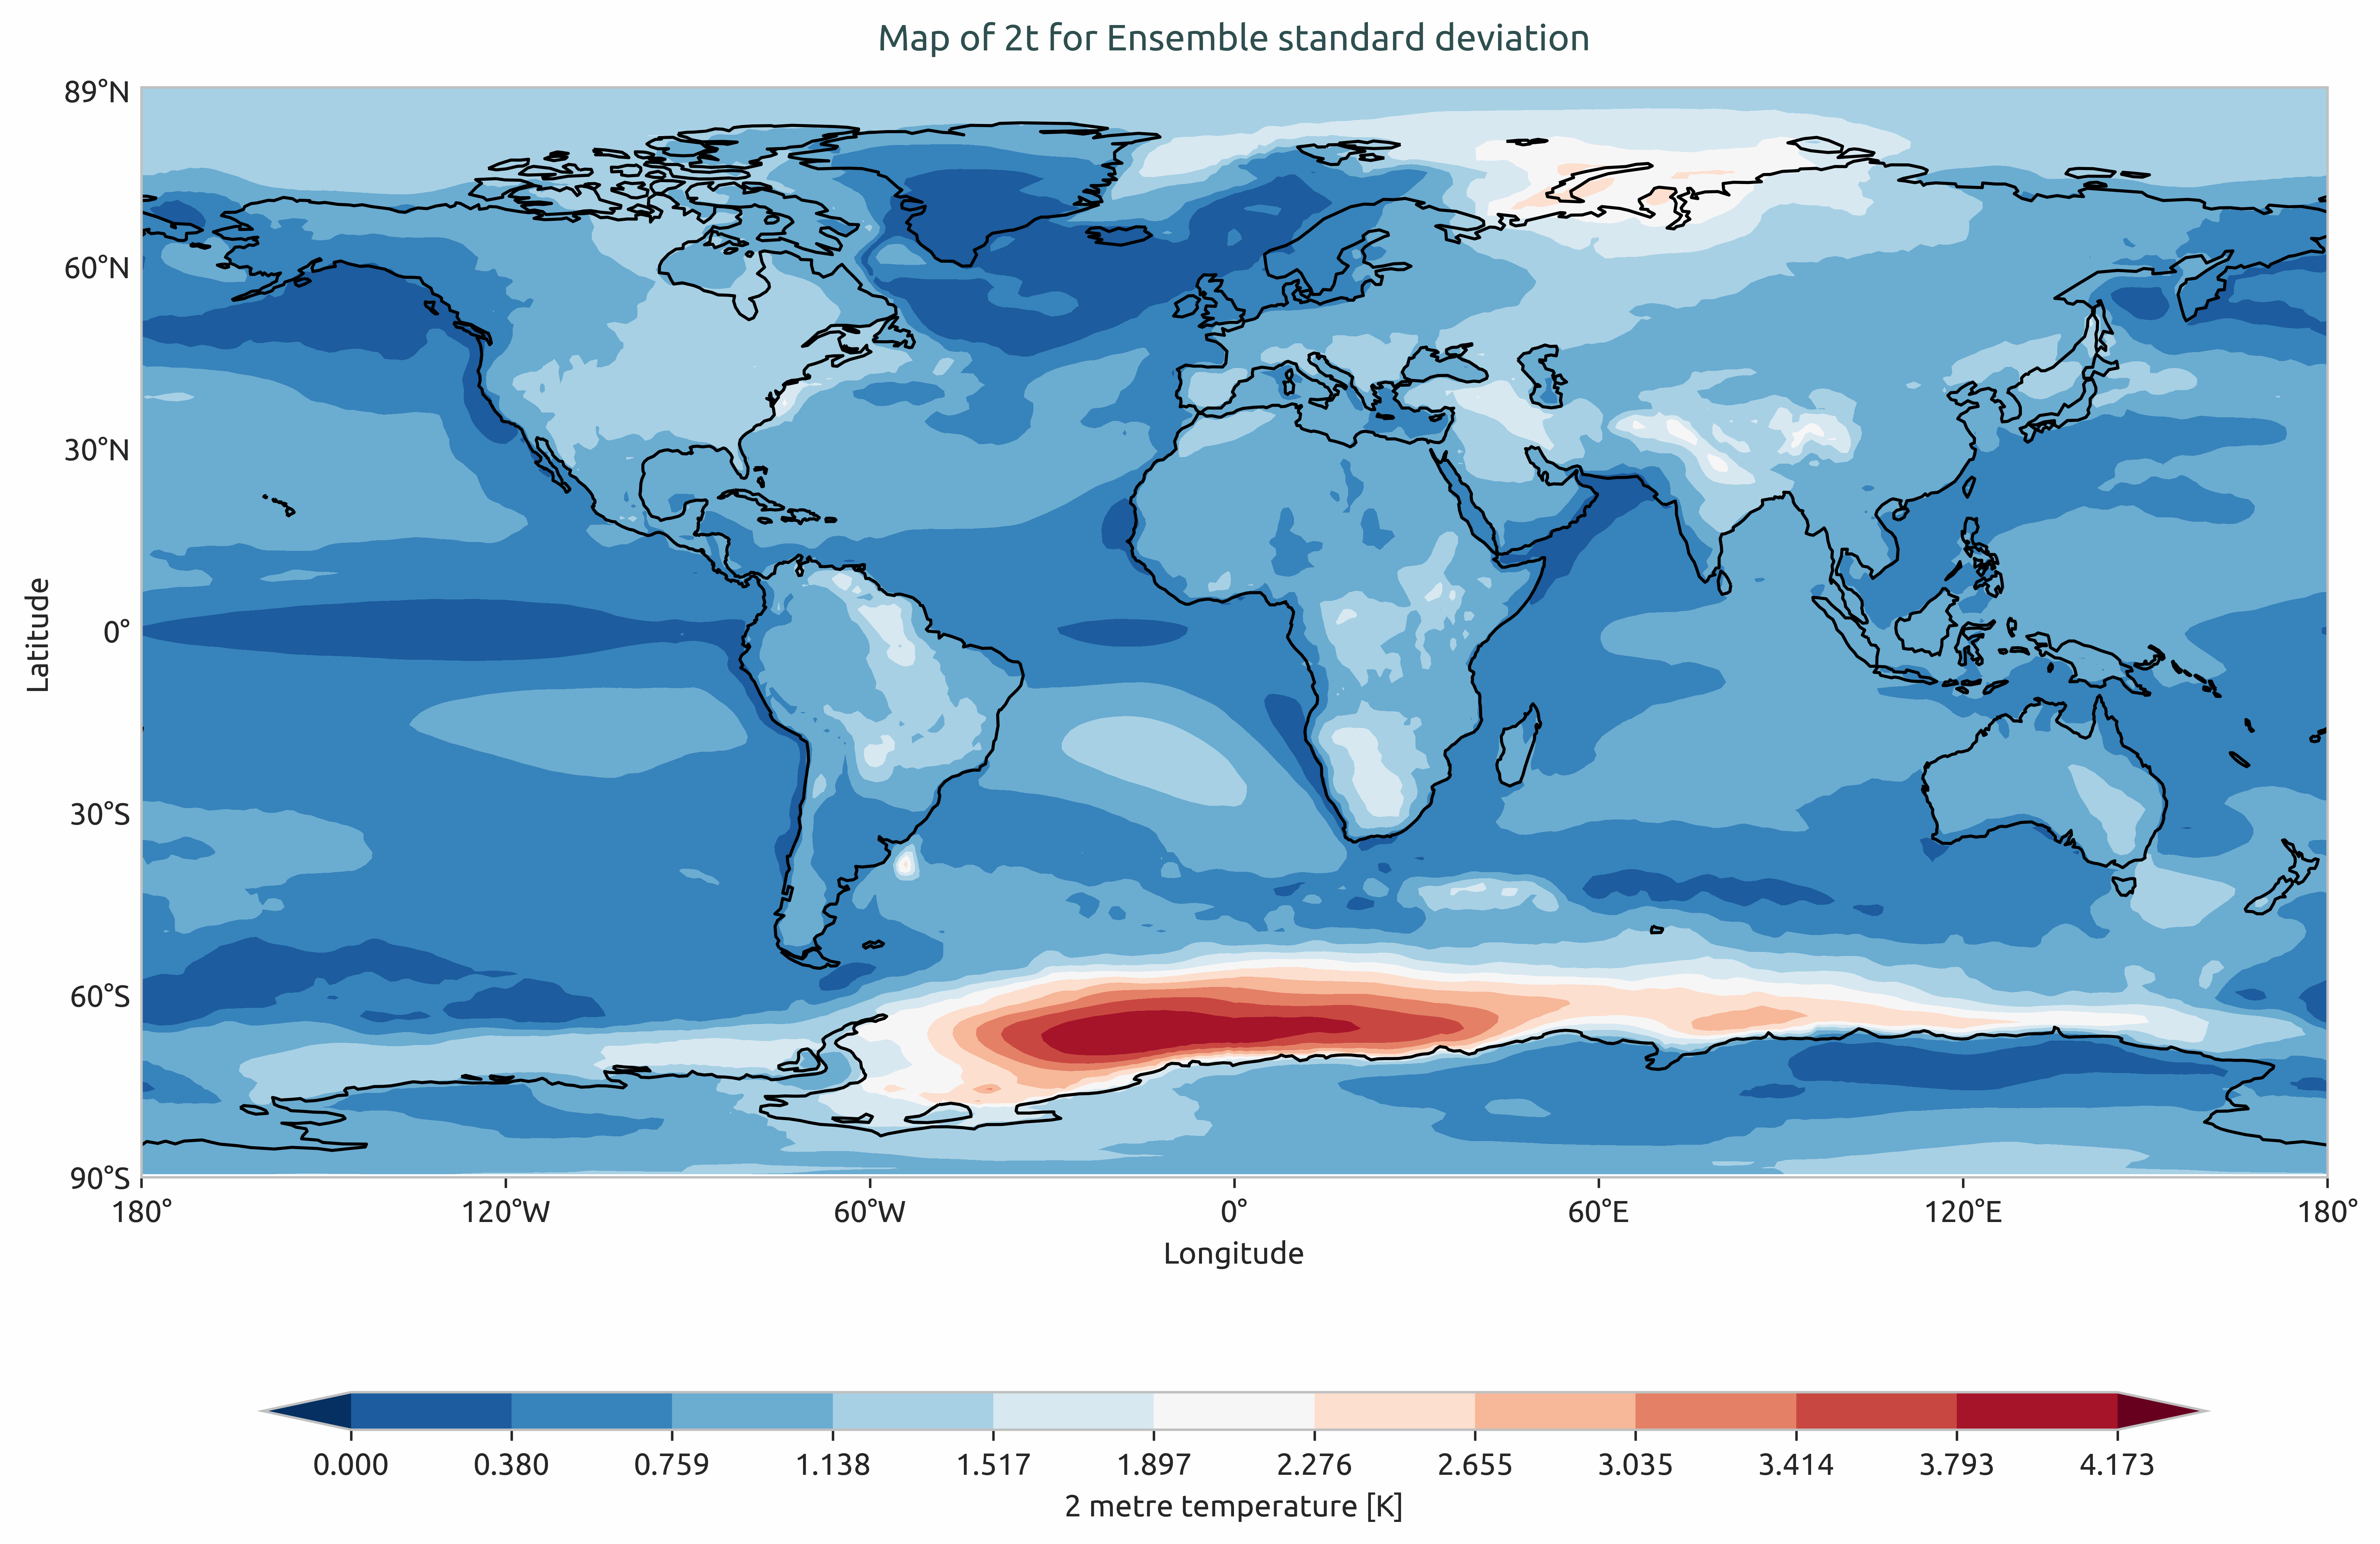
Ensemble standard devation of multi-model of the global mean of 2-meter temperature. Models considered as IFS-NEMO and IFS-FESOM.
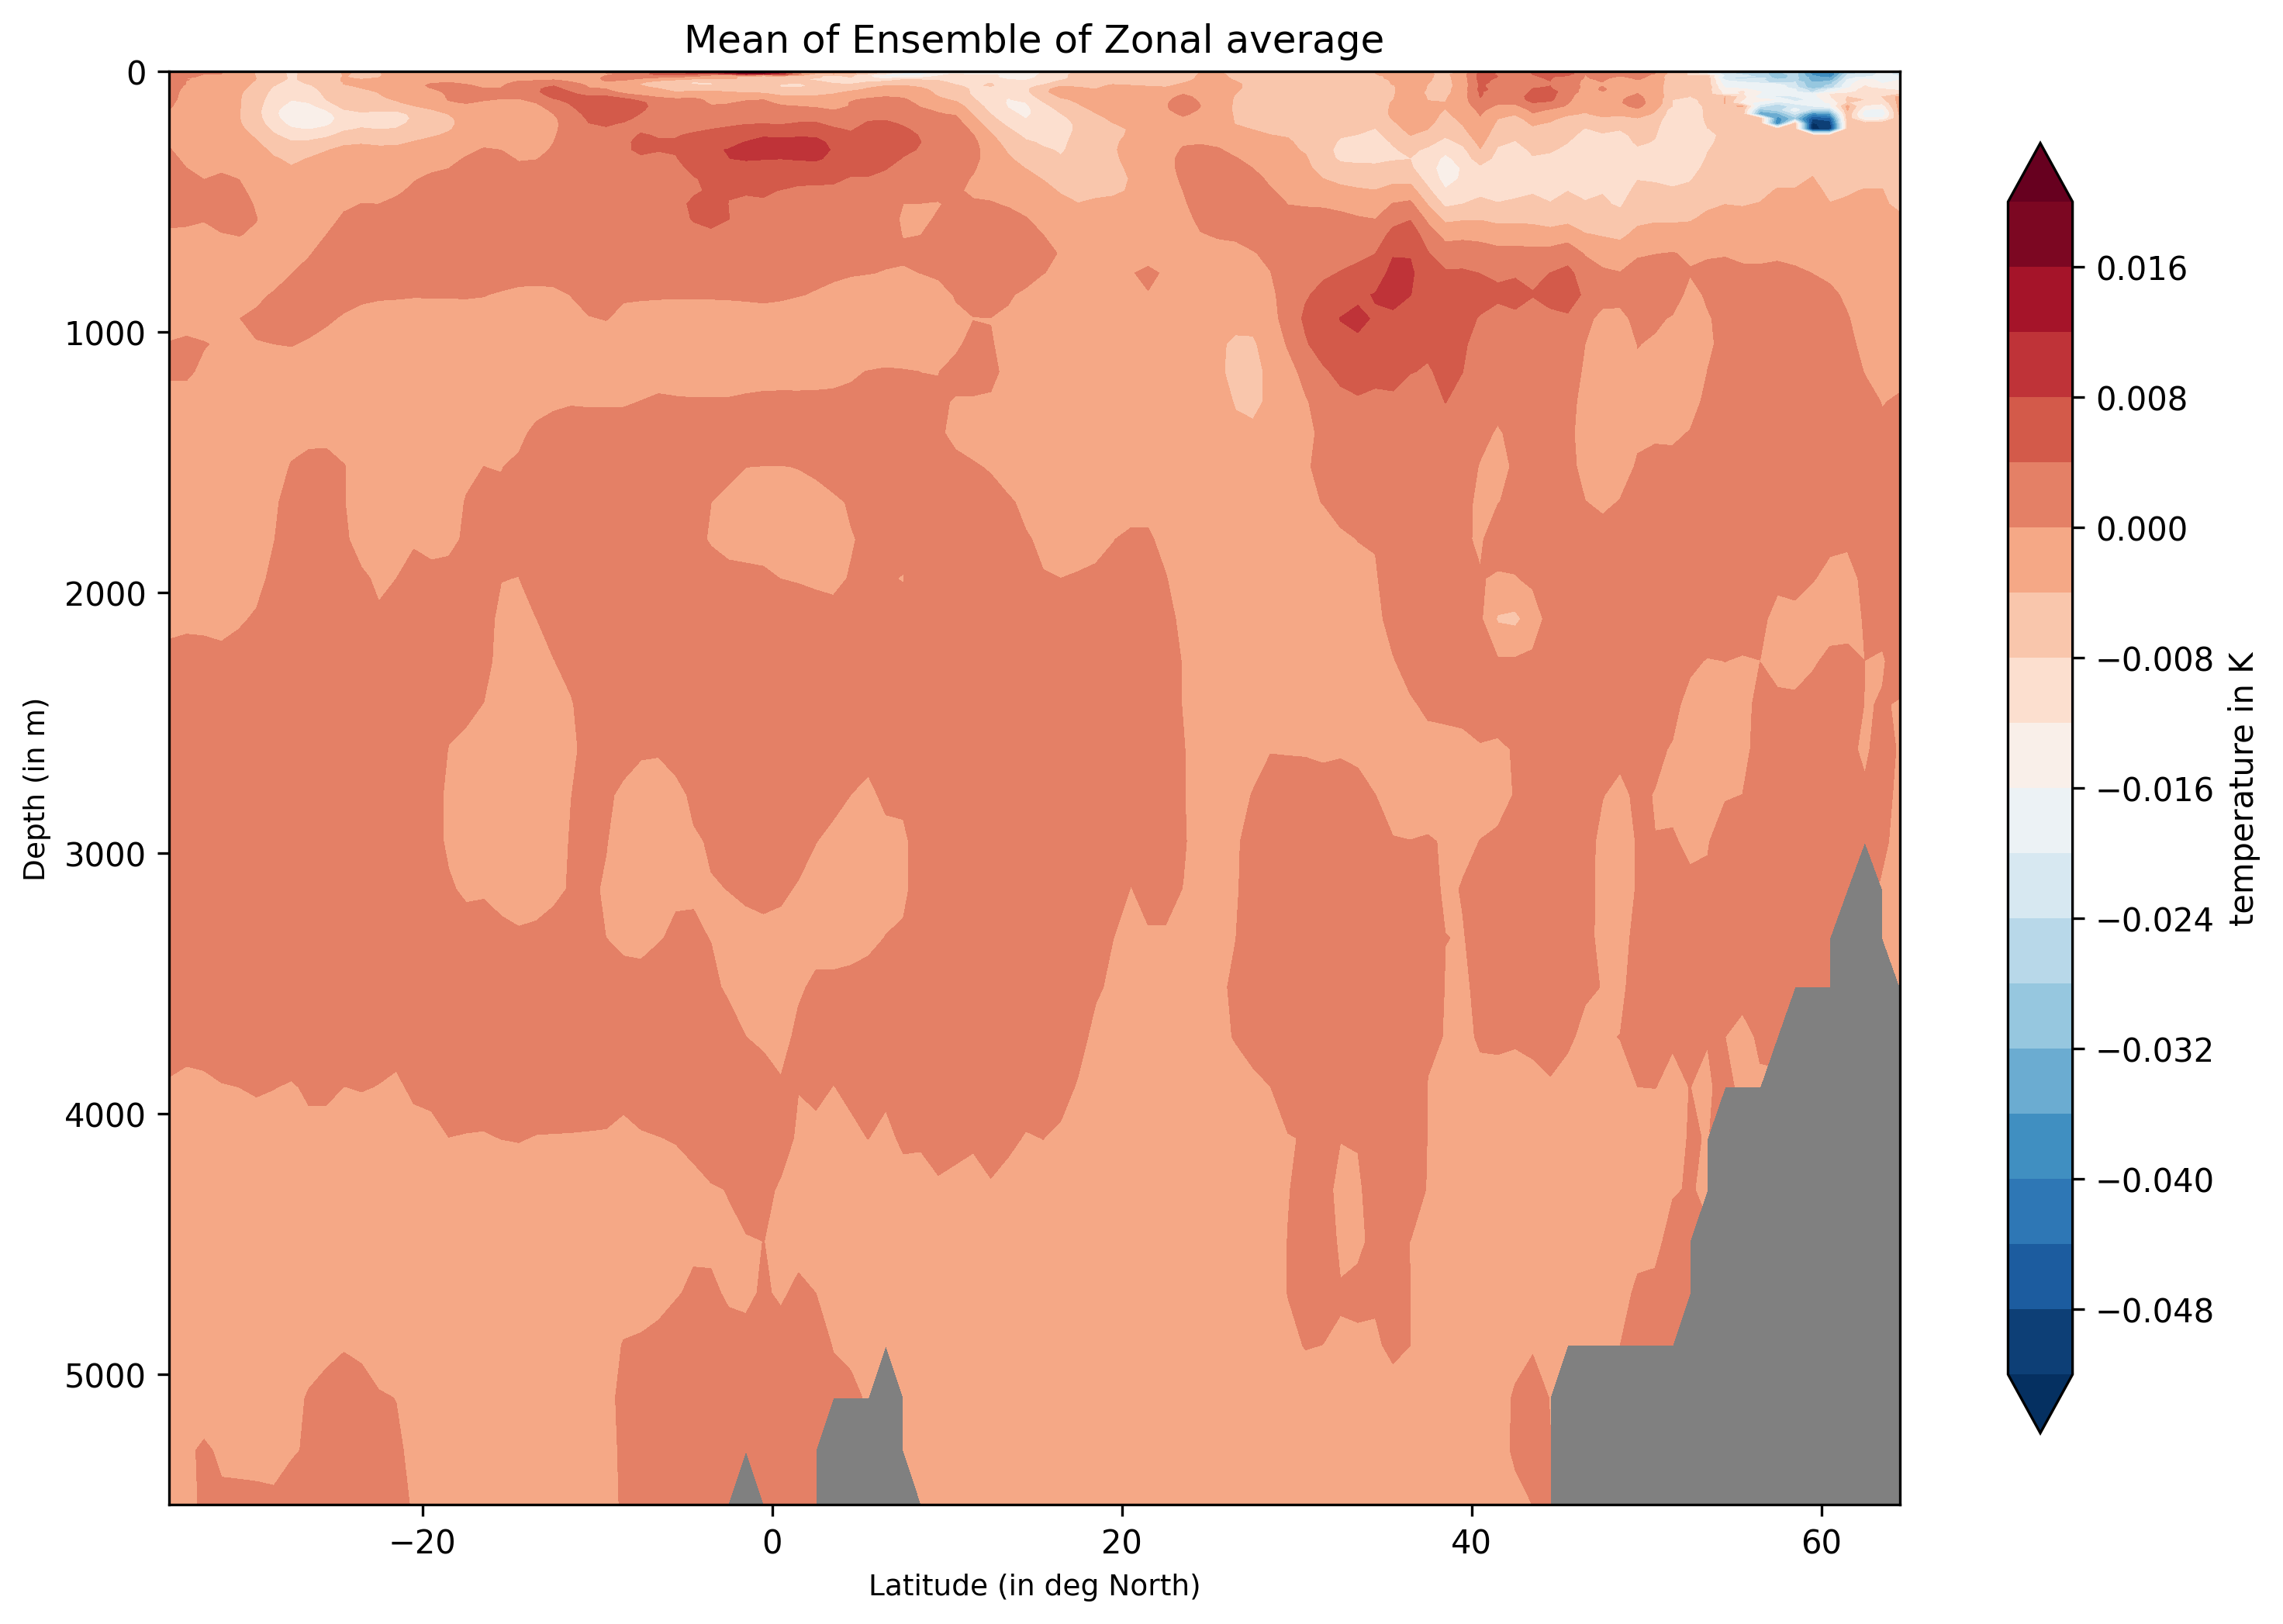
Ensemble-Zonal mean for average Time-mean sea water practical salinity for IFS-NEMO historical-1990.
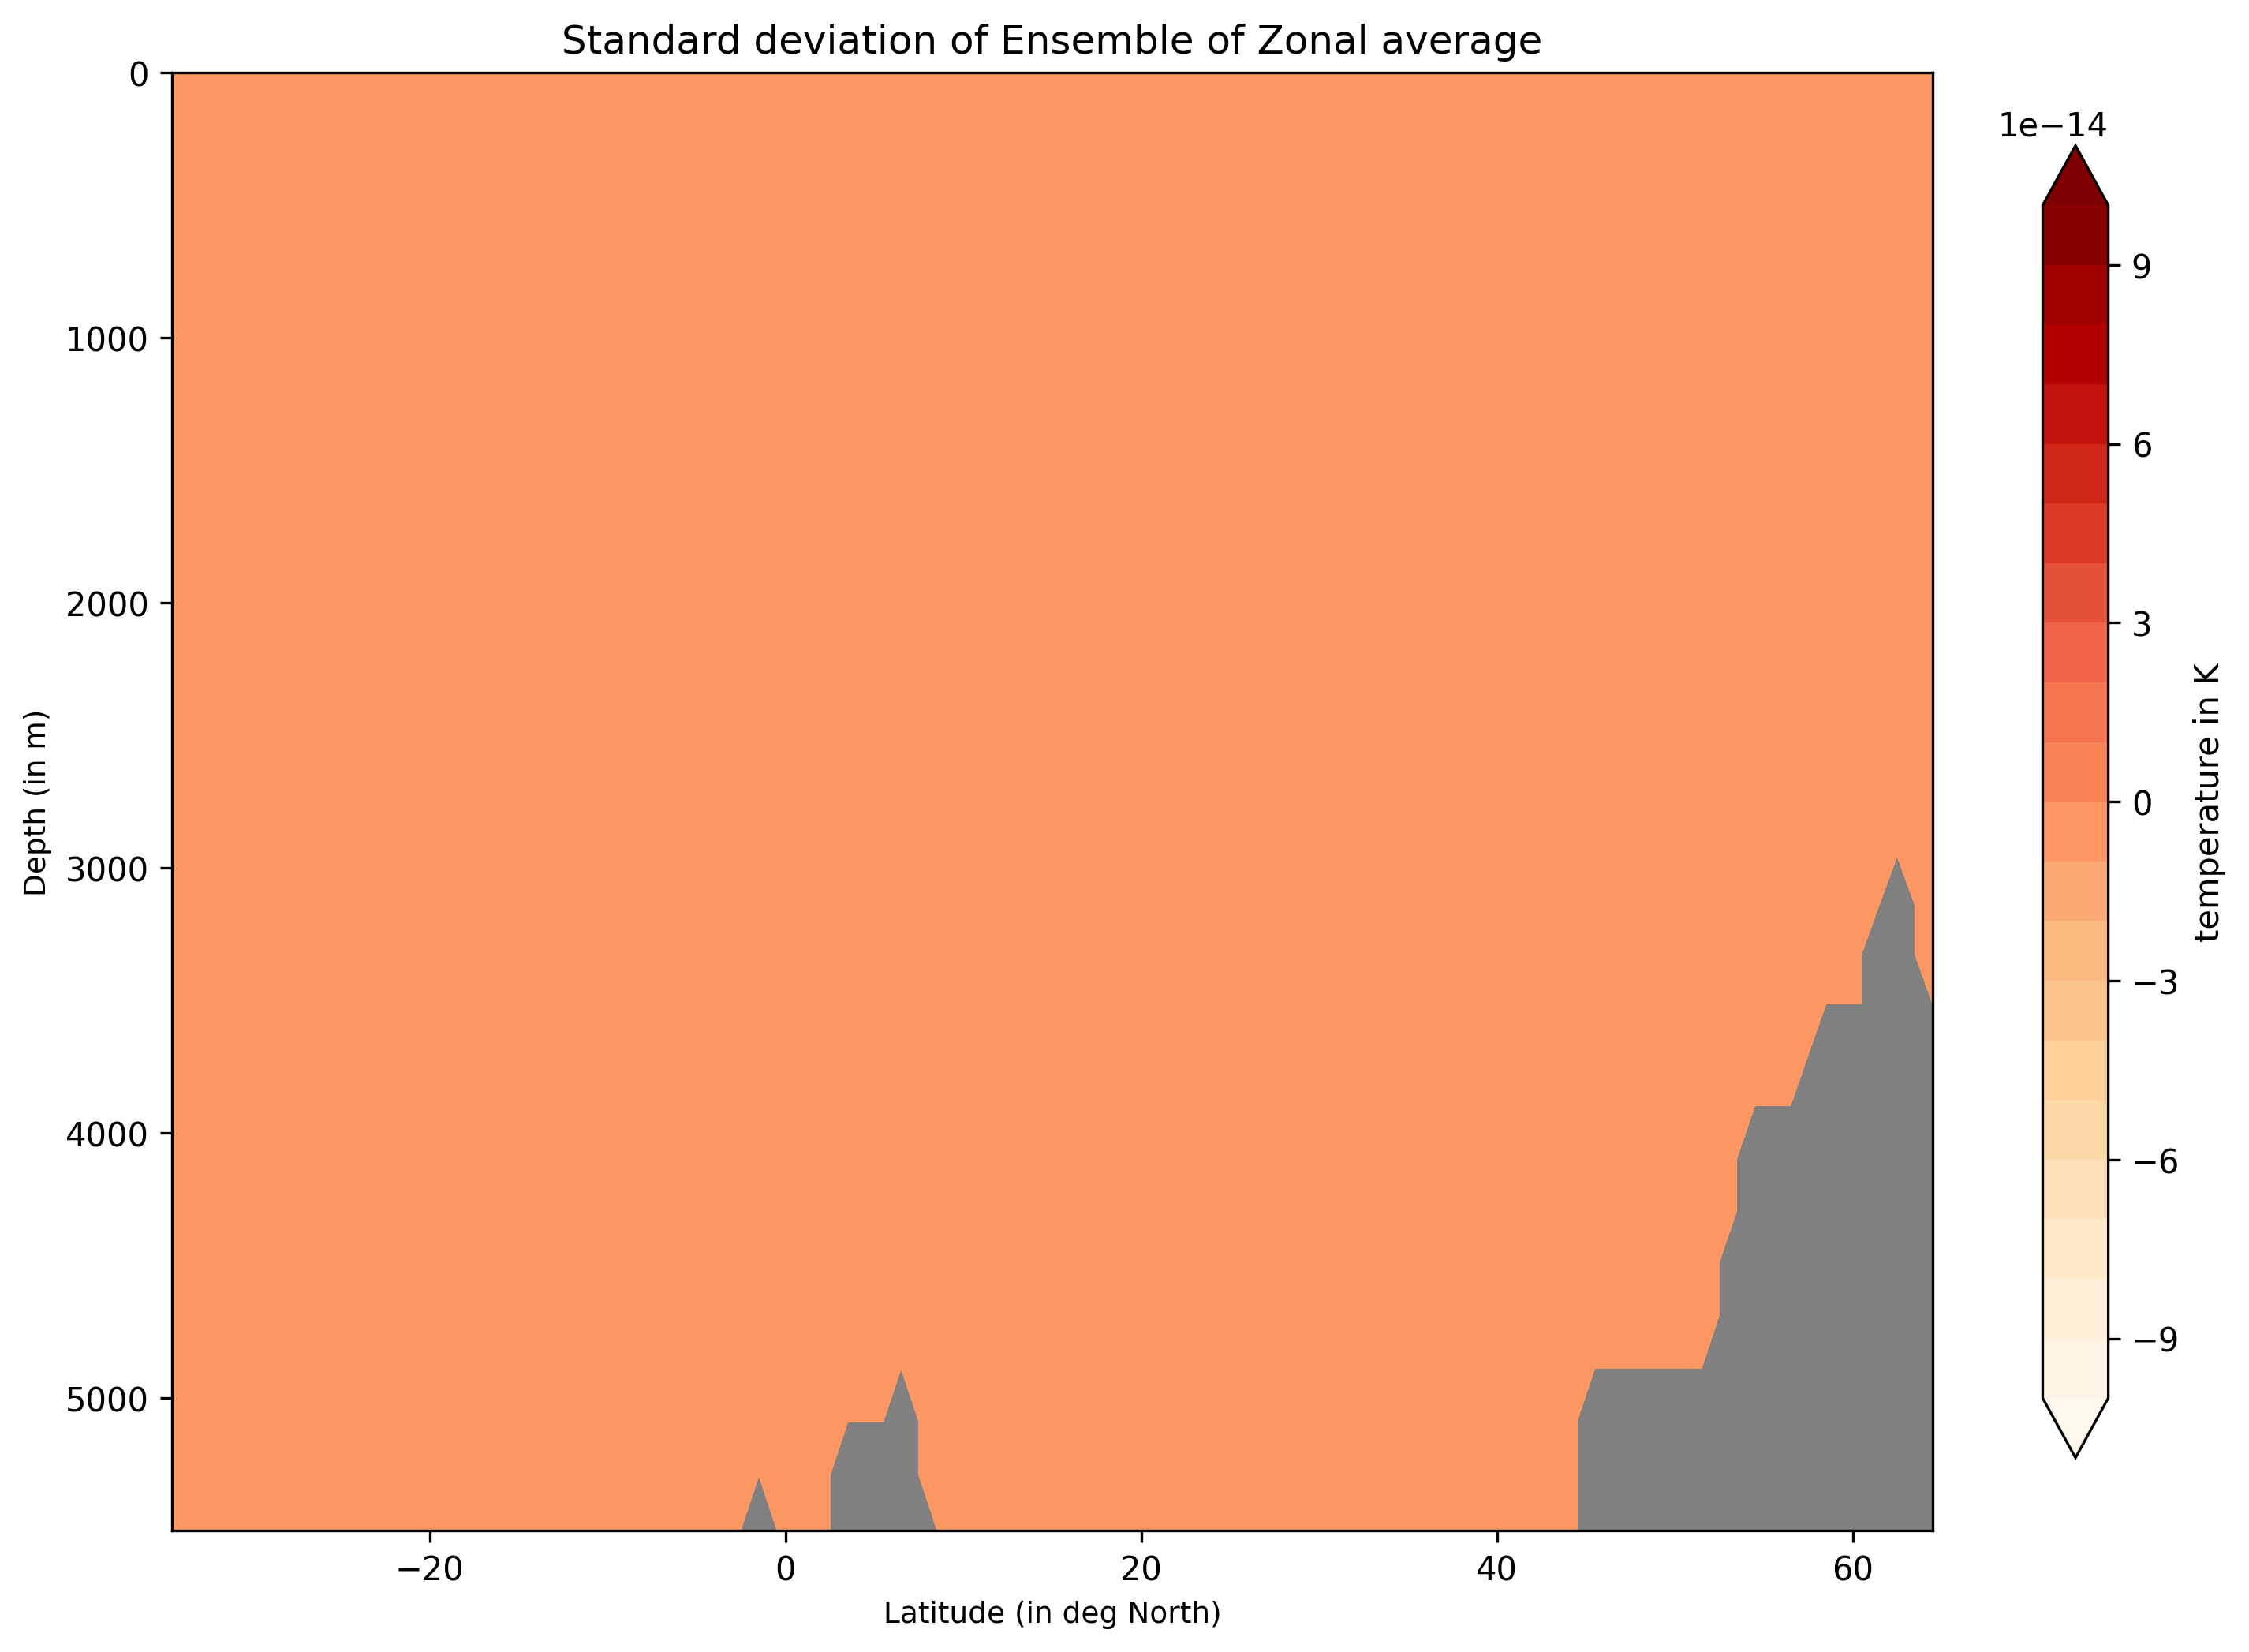
Ensemble-Zonal standard deviation for average Time-mean sea water practical salinity for IFS-NEMO historical-1990.
Detailed API
This section provides a detailed reference for the Application Programming Interface (API) of the ensemble diagnostic,
produced from the diagnostic function docstrings.